
15 Apr Q1 2024 “Student of the Markets”
- The Rally Continues
The stock market rally induced by the Fed’s pivot in late October continued through the first quarter.
- Fading Dominance
The dominance of the Magnificent Seven faded during the first quarter as three of the basket’s seven members trailed the broader market with two members—Apple and Tesla—both posting double-digit declines.

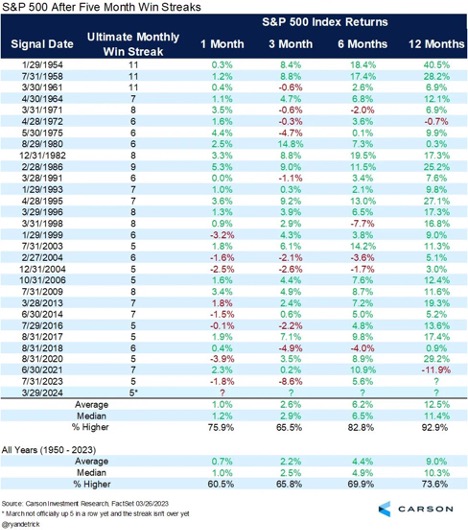
- The Trend is Your Friend
Historical experience suggests the current rally may still have legs left.
- Happy Anniversaries
March 9th marked the 15-year anniversary of the market’s bottom during Global Financial Crisis bear market which was the worst bear market since the Great Depression. Since then, it’s increased over 10x, generating a 16.8% annualized return.

What if you bought in at the market’s peak in October 2007 before the financial crisis? Incredibly, you’re still up 367% or 9.8% annualized, despite experiencing an initial 55% drawdown.

March also marked the four-year anniversary of the market’s bottom during the Covid-induced bear market. Since March 23, 2020, the market is up more than 150% or 25.7% annualized.

What if you bought in at the peak on February 19, 2020, just before the market sold off more than 30% over the subsequent five weeks? You’re still up more than 65% or 13.1% annualized.

- Earnings
The S&P 500 collectively posted no earnings growth in 2023. According to data from Morgan Stanley, analysts are optimistic for the years ahead, expecting companies to post double-digit earnings growth in 2024 and 2025.

Source: Morgan Stanley Research via @dailychartbook.
J.P. Morgan further shows that analysts expect the Magnificent Seven stocks to deliver superior earnings growth during the next few quarters but that “the rest” will fundamentally outperform during the fourth quarter of 2024.

Source: FactSet, Standard & Poor’s, J.P. Morgan Asset Management Guide to the Markets – U.S. Data are as of March 31, 2024.
*Magnificent Seven includes APPL, AMZN, GOOG, GOOGL, META, MSFT, NVDA and TSLA. Earnings estimates for 2024 are forecasts based on consensus analyst expectations.
State Street shows that strong earnings growth isn’t just limited to the US as earnings are expected to rise across the globe in 2024 with emerging markets, the S&P 500 and Japan leading the way.
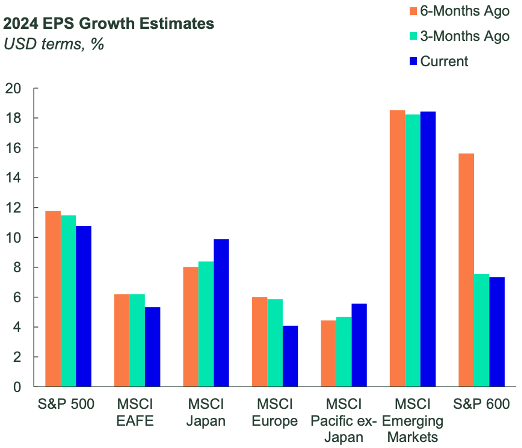
Source: FactSet, SSGA SPDR Monthly Chart Pack (March 2024), as of February 29, 2024. Characteristics are as of the date indicated, are subject to change, and should not be relied upon as current thereafter.
EPS growth estimates are based on Consensus Analyst Estimates compiled by FactSet. Projected characteristics are based upon estimates and reflect subjective judgments and assumptions. There can be no assurance that developments will transpire as forecasted and that the estimates are accurate.
- US Equity Market Valuations
The overall market trades a bit rich relative to the last 30 years.
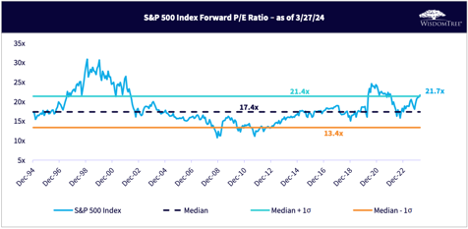
Source: WisdomTree Daily Dashboard (April 1, 2024). Historical forward P/E measured since 12/31/1994. Expanded Tech includes the Information Technology sector, Interactive Home Entertainment subindustry, Interactive Media & Services subindustry, Amazon, E-Bay, Etsy, and Netflix. Ex-Tech excludes the expanded tech companies.
Excluding technology, however, valuations are more in line with historical averages.
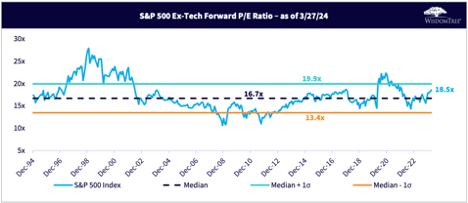
Source: WisdomTree Daily Dashboard (April 1, 2024). Historical forward P/E measured since 12/31/1994. Expanded Tech includes the Information Technology sector, Interactive Home Entertainment subindustry, Interactive Media & Services subindustry, Amazon, E-Bay, Etsy, and Netflix. Ex-Tech excludes the expanded tech companies.
Relatedly, value stocks remain relatively cheap vs. their growth counterparts on a historical basis.
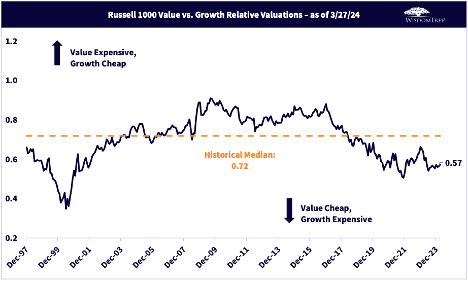
Source: WisdomTree Daily Dashboard (April 1, 2024).
- Historical “Bubble” Comps
Apollo believes that the current AI bubble is bigger than the 1990s tech bubble as the top 10 companies in the S&P 500 today are more expensively valued than the top 10 companies were during the tech bubble in the mid-1990s.
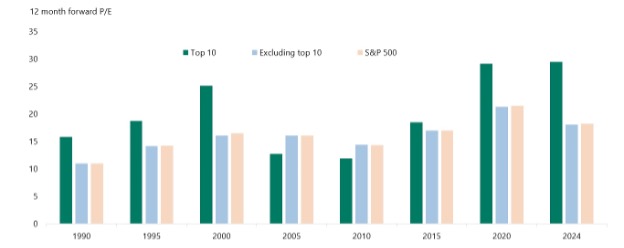
Source: Bloomberg, Apollo Chief Economist. Note: Data as of January 31, 2024.
On the other hand, Goldman Sachs is less concerned about the valuations of the largest stocks as they show that while the degree of market concentration today is higher than at the peak of the Tech Bubble in 2000 and at the peak of the “Nifty Fifty” period in 1973, the largest stocks today carry much lower valuation multiples and generally have higher profit margins and returns on equity than the top stocks in either 1973 or 2000.
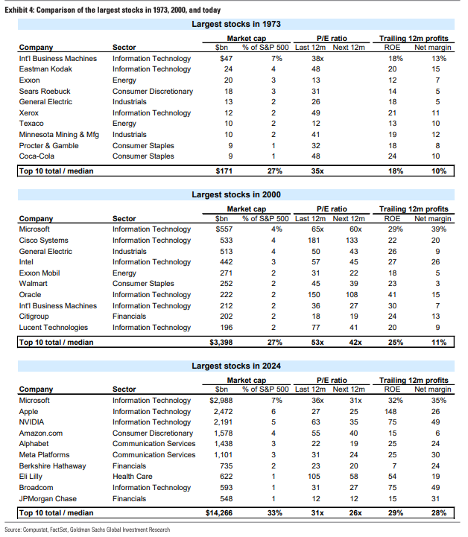
Source: Goldman Sachs US Equity Views—100 Years of US Equity Market Concentration and Momentum (March 7, 2024).
- The Drawdown Continues
While the US stock market has been delivering new highs since January, the US bond market remains in its longest drawdown in history: 44 months and counting.

The current bond market drawdown: 10.5% from the 2020 peak.

- Short Duration Materially Outperforming
Ultra-short-term and short-term bonds have held up considerably better since the bond market began its historic drawdown after peaking in July 2020 when the 10-year US treasury yield ended the month at a paltry 0.55%.

- Higher Rates = Higher Expected Returns
The good news for bond investors? Future returns should be much better as the single best predictor of future bond returns is the starting yield. With the 10-year US Treasury yield standing at 4.2% as of the end of March, the return outlook over the next seven years is much improved from just a few years earlier.

- The Good: Strong Labor Markets
Job growth continues to power on. February was the 39th consecutive month of jobs growth in the US.

The unemployment rate has been below 4% for 25 consecutive months, the longest streak of sub-4% unemployment since the late 1960s.

The number of job openings continues to exceed the number of people seeking work. This means that even if growth were to slow from here, there is a buffer before unemployment starts causing a problem. Excess demand for labor today reduces the risk that we will experience a disruptive surge in unemployment.

- The Good: Continued Personal Income Growth
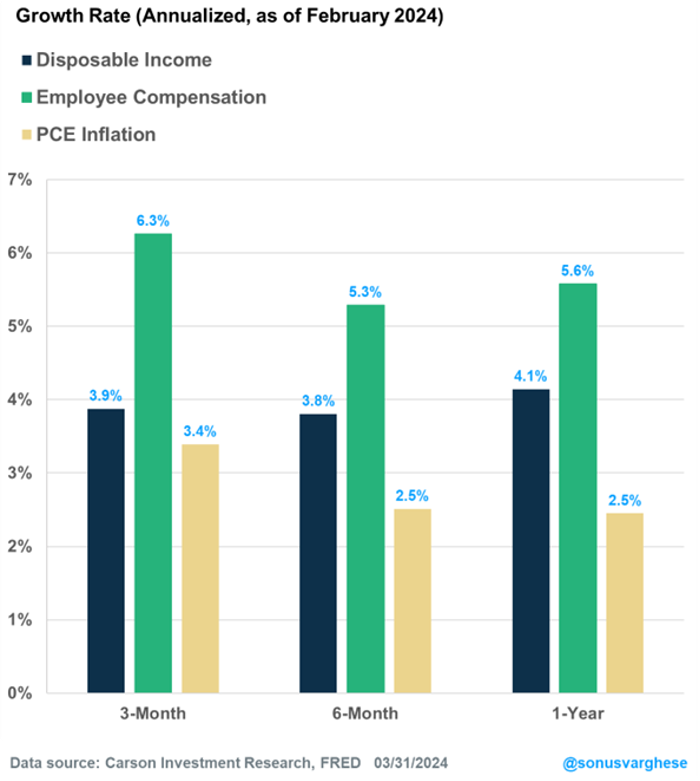
Ultimately, what matters for an economy that runs mostly on consumption is inflation-adjusted income growth.
Fortunately, income growth has outpaced inflation by a decent margin over the last three, six and 12 months.
- The Good: Resilient Housing Market
US home prices hit another all-time high in January and are up more than 6% over the last year, continuing to defy expectations that higher interest rates would lead to a collapse in the housing market.

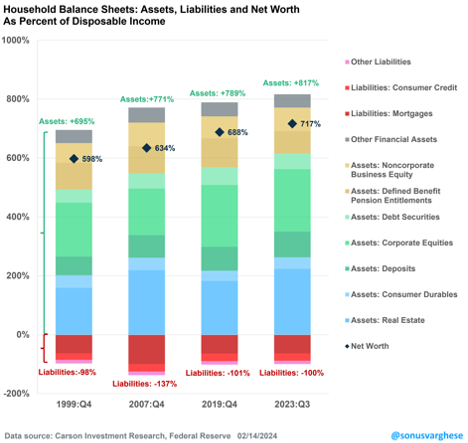
- The Good: All-Time High in Household Net Worth
US household net worth is at an all-time high relative to disposable income as of the latest data (Q3 2023). The ongoing stock market rally combined with the aforementioned ongoing home price appreciation since then means the picture today is likely even better.
- The Good: Household Debt is Predominantly Fixed Rate
Honing in on the liability side of household’s balance sheets, it’s important to recognize that according to Apollo, 89% of US household debt is fixed rate and just 11% is floating rate. As such, households have to a degree been immunized against the full impact of rising interest rates.
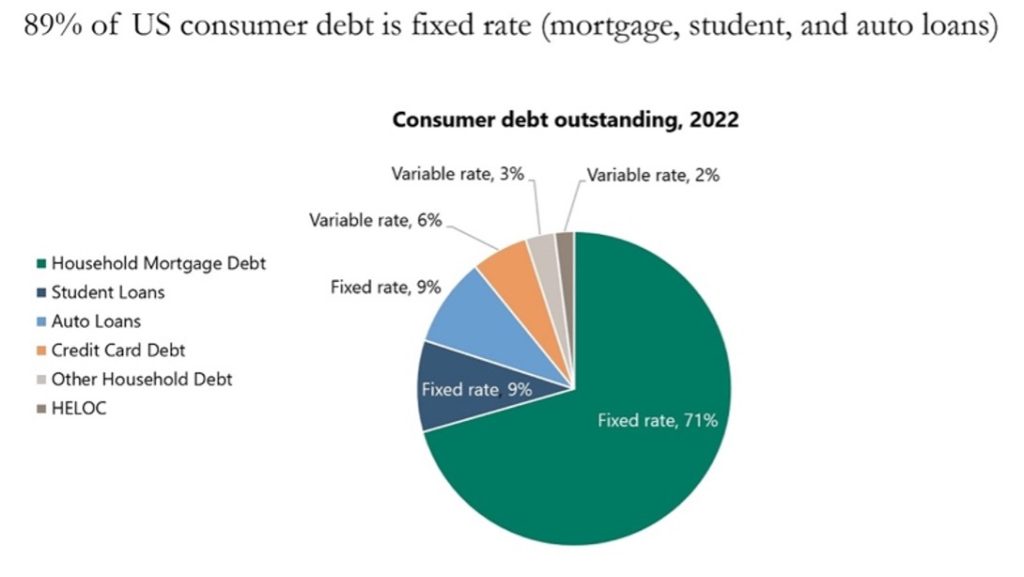
Source: FRBNY Consumer Credit Panel, Haver Analytics, Apollo Chief Economist.
- The Good: Higher Rates = Higher Interest Payments and Higher Interest Income
While higher interest rates are no doubt a negative for those with floating rate debt or those looking to take on new debt, an often overlooked aspect of higher rates is that they also mean higher interest income for savers. The charts below show that interest income received by households has risen alongside of household interest payments over the last two years.

- The Good: Household Debt Service Still Historically Low
Household debt service ratio (debt service payments as a percentage of disposable personal income) remains well below historical averages.

- The Good: Bank Deposit Flight Stemmed
One year after the onset of the regional banking crisis that was precipitated by the failure of Silicon Valley Bank in March of last year, it appears the much-feared scenario of widespread bank runs as been avoided (at least for now) as bank deposits have stabilized at both large and small banks.

- The Concerning: Emerging Signs of Waning Consumer Confidence and Building Financial Stress
Workers are quitting jobs far less frequently than in the relatively recent past. The percentage of workers quitting their jobs was 2.2% in February, remaining at the lowest level since August 2020 for the fourth consecutive month, although well above the levels that persisted for much of the pre-pandemic expansion.

Here we see a few additional signs that consumers are increasingly facing financial stress:
- The personal savings rate has declined precipitously over the last few years to below-average levels after spiking during the first year of the pandemic (see chart on the left).
- Consumers have largely exhausted the excess savings they accumulated during the pandemic (see chart on the top right).
- Revolving consumer credit (e.g., credit card debt) has started to rise again in recent months albeit to still well-below historical average levels as consumers have begun borrowing more (see chart on the bottom right).

Source: BEA, Federal Reserve, J.P. Morgan Asset Management Guide to the Markets – U.S. Data are as of February 29, 2024.
- The Concerning: Commercial Real Estate
Banks, particularly small banks, remain heavily exposed to commercial real estate loans.
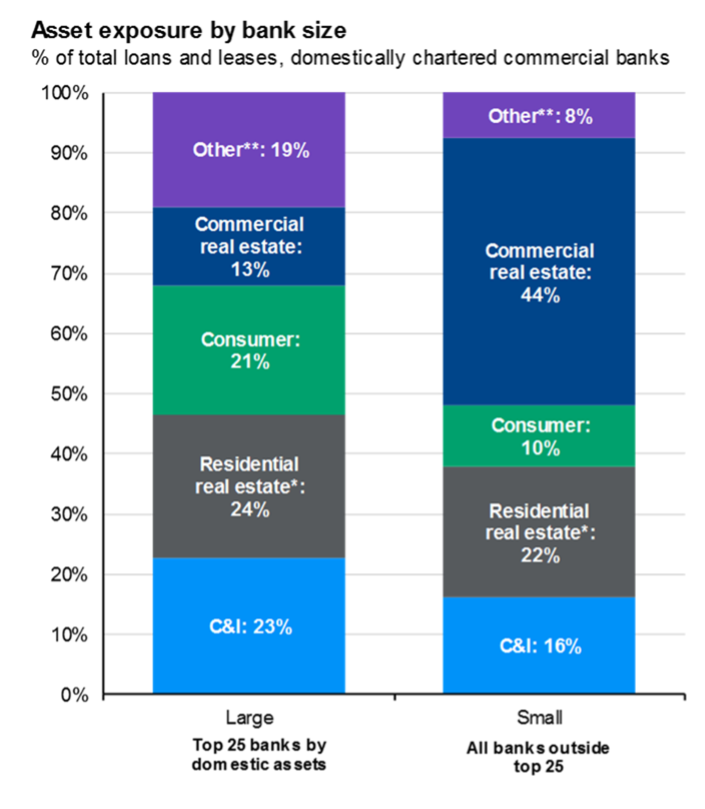
Source: Bankrate, Bloomberg, Crane Data, FDIC, Federal Reserve, J.P. Morgan Asset Management Guide to the Markets – U.S. Data are as of February 29, 2024. Bank asset exposure is based on the monthly H.8 report by the Federal Reserve. Large banks are defined as the top 25 domestically chartered commercial banks ranked by domestic assets while small banks are defined as all other domestically chartered commercial banks. *Residential real estate includes residential real estate loans, revolving home equity loans and closed-end real estate loans. **Other includes loans for purchasing or carrying securities, loans to finance agricultural production, loans to foreign governments and foreign banks, obligations of states and political subdivisions, loans to nonbank depository institutions, unplanned overdrafts, loans not elsewhere classified and lease financing receivables.
Commercial real estate prices have broadly declined by 10 to 20% depending on the sector while transaction activity has fallen by around half suggesting that a valuation gap remains between potential buyers and sellers.

Note, however, that more recently, apart from the office sector, prices appear to have stabilized or bottomed. Ultimately, the direction of rates and the economy will likely determine how much further the correction in prices has to go.
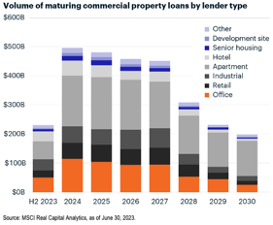
One salient concern for commercial real estate moving forward, however, is that the refinancing need in the years ahead is large. In the coming years, the market is faced with a significant level of loan maturities and many borrowers will be forced to refinance into (likely) higher rates. This has the potential to present a challenge for property owners in the years ahead.
- The Concerning: Inflation and Monetary Policy
Headline and core (inflation excluding energy and food prices) inflation have both cooled materially over the last year after peaking at multi-decade highs in 2022. Both measures are currently in the 3-4% range which, while certainly improved from the peak levels, is still noticeably above the Fed’s 2% target. Concerningly, both measures appear to have stalled their downward trend in recent months.

Looking forward, a key risk to the markets is that inflation becomes “sticky” at current levels, or worse, reaccelerates amid continued strong economic growth and loose financial conditions. This would give the Fed reason to delay cutting rates (which the market has become optimistic about) or even possibly raising rates further (a scenario that hasn’t appeared to have been even considered remotely possible by many market participants).
While recent reads on inflation have surprised to the upside, it’s worth noting that one of the most important drivers of inflation, shelter/housing, is trending lower.
Important Disclosures
Kathmere Capital Management (Kathmere) is an investment adviser registered under the Investment Advisers Act of 1940. Registration as an investment adviser does not imply any level of skill or training. The firm only transacts business in states where it is properly registered or is excluded from registration requirements. Content in this presentation should not be regarded as a complete analysis of the subjects discussed. All expressions of opinion reflect the judgment of the author on the date of publication and are subject to change. Information presented does not involve the rendering of personalized investment and should not be viewed as an offer to buy or sell any securities discussed. Tax information provided is general in nature and should not be construed as legal or tax advice. Always consult an attorney or tax professional regarding your specific legal or tax situation. Tax and ERISA rules are subject to change at any time. All investment strategies have the potential for profit or loss. Different types of investments involve higher and lower levels of risk. There is no guarantee that a specific investment or strategy will be suitable or profitable for an investor’s portfolio. Historical performance returns for investment indexes and/or categories, usually do not deduct transaction and/or custodial charges or an advisory fee, which would decrease historical performance results. There are no guarantees that a portfolio will match or outperform a specific benchmark. Market performance results and index returns do not represent the performance of Kathmere or any of its advisory clients.
The information presented in the material is general in nature and is not designed to address your investment objectives, financial situation or particular needs. Prior to making any investment decision, you should assess, or seek advice from a professional regarding whether any particular transaction is relevant or appropriate to your individual circumstances. Although taken from reliable sources, Kathmere cannot guarantee the accuracy of the information received from third parties.
The opinions expressed herein are those of Kathmere and may not actually come to pass. This information is current as of the date of this material and is subject to change at any time, based on market and other conditions. Index performance used throughout is intended to illustrate historical market trends and performance. Indexes are managed and do not incur investment management fees. An investor is unable to invest in an index. Past performance is no guarantee of future results.
The mention of specific securities and sectors illustrates the application of our investment approach only and is not to be considered a recommendation by Kathmere Capital Management. The specific securities identified and described above do not represent all of the securities purchased and sold for the portfolio, and it should not be assumed that investment in these types of securities were or will be profitable. There is no assurance that securities discussed in this article have been purchased or remain in the portfolio or that securities sold have not been repurchased. It should not be assumed that any change in investments, discussed in this article have been applied to your account. Please contact your investment adviser to discuss your account in detail.
The information herein was obtained from various sources. Kathmere does not guarantee the accuracy or completeness of information provided by third parties. The information in this report is given as of the date indicated and believed to be reliable. Kathmere assumes no obligation to update this information, or to advise on further developments relating to it.
All investment strategies have the potential for profit or loss. Different types of investments involve higher and lower levels of risk. There is no guarantee that a specific investment or strategy will be suitable or profitable for an investor’s portfolio.
Historical performance returns for investment indexes and/or categories, usually do not deduct transaction and/or custodial charges or an advisory fee, which would decrease historical performance results. There are no guarantees that a portfolio will match or outperform a specific benchmark. Index returns do not represent the performance of Kathmere Capital Management or any of its advisory clients.
The opinions voiced in this material are for general information only and are not intended to provide specific advice or recommendations for any individual. To determine which investment(s) may be appropriate for you, consult your financial advisor prior to investing.
Economic forecasts set forth may not develop as predicted and there can be no guarantee that strategies promoted will be successful.
There is no guarantee that a diversified portfolio will enhance overall returns or outperform a non-diversified portfolio. Diversification does not ensure against market risk. Asset allocation and diversification do not assure or guarantee better performance and cannot eliminate the risk of investment losses.
Tactical allocation may involve more frequent buying and selling of assets and will tend to generate higher transaction cost. Investors should consider the tax consequences of moving positions more frequently.
Stock Investment Risk
Stock investing involves risk including loss of principal.
Investing in stock includes numerous specific risks including: the fluctuation of dividend, loss of principal and potential illiquidity of the investment in a falling market.
Investing in foreign and emerging markets securities involves special additional risks. These risks include, but are not limited to, currency risk, geopolitical risk, and risk associated with varying accounting standards. Investing in emerging markets may accentuate these risks.
Currency risk is a form of risk that arises from the change in price of one currency against another. Whenever investors or companies have assets or business operations across national borders, they face currency risk if their positions are not hedged.
Bond Investment Risk
Bonds are subject to market and interest rate risk if sold prior to maturity. Bond and bond mutual fund values and yields will decline as interest rates rise and bonds are subject to availability and change in price.
Government bonds and Treasury bills are guaranteed by the U.S. government as to the timely payment of principal and interest and, if held to maturity, offer a fixed rate of return and fixed principal value. However, the value of fund shares is not guaranteed and will fluctuate.
High-yield/junk bonds are not investment-grade securities, involve substantial risks, and generally should be part of the diversified portfolio of sophisticated investors.
Municipal bonds are subject to availability, price, and to market and interest rate risk if sold prior to maturity. Bond values will decline as interest rate rise. Interest income may be subject to the alternative minimum tax. Federally tax-free but other state and local taxes may apply.
Investing in foreign and emerging markets debt securities involves special additional risks. These risks include, but are not limited to, currency risk, geopolitical and regulatory risk, and risk associated with varying settlement standards.
Alternative Investments Risk
Alternative strategies may not be suitable for all investors and should be considered as an investment for the risk capital portion of the investor’s portfolio. The strategies employed in the management of alternative investments may accelerate the velocity of potential losses.
Investing in real estate/REITs involves special risks such as potential illiquidity and may not be suitable for all investors. There is no assurance that the investment objectives of this program will be attained.
Commodity-linked investments may be more volatile and less liquid than the underlying instruments or measures, and their value may be affected by the performance of the overall commodities baskets as well as weather, geopolitical events, and regulatory developments.
The fast price swings of commodities may result in significant volatility in an investor’s holdings.
There is a risk of substantial loss associated with trading commodities, futures, options, derivatives and other financial instruments. Before trading, investors should carefully consider their financial position and risk tolerance to determine if the proposed trading style is appropriate. Investors should realize that when trading futures, commodities, options, derivatives and other financial instruments one could lose the full balance of their account. It is also possible to lose more than the initial deposit when trading derivatives or using leverage. All funds committed to such a trading strategy should be purely risk capital.