
08 Apr A Good Time to Buy?
Following its 4.3% decline on March 20, the S&P 500 Index had declined by nearly 32% from its all-time high, achieved just a little more than a month earlier. In this commentary, I examine how the S&P 500 has historically fared following a decline of 30% or more from a recent all-time high.
In the post-World War II (WWII) era, the S&P 500 has previously experienced five bear markets that ultimately saw the index down by at least 30%, excluding the current bear market. As we know, following each of the past 30% or greater declines, the market (and economy) ultimately recovered as the market went on to establish new all-time highs. The table below reveals that on average, it took the S&P 500 approximately four years from the day its decline crossed the 30% threshold to the time it achieved a new all-time high (note: all index and performance figures cited in this commentary reflect price-only values and returns).
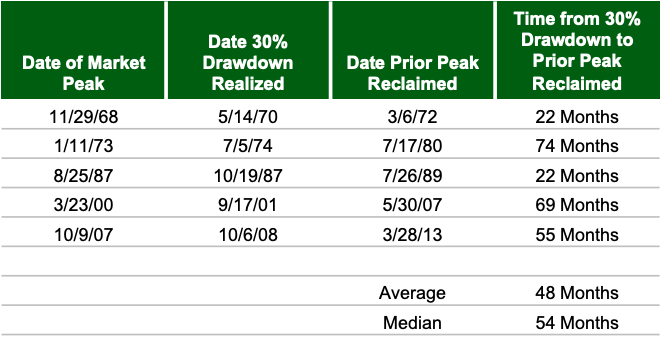
In the table below, I inspect each of these past five bear markets in additional detail. Specifically, the table below examines how the S&P 500 Index performed after breaching the 30% drawdown threshold.
The right side of the table demonstrates that historically, on average, the market has recovered quite strongly from declines of this magnitude. On average, that market has gained more than 10% in the year following crossing the 30% threshold. Looking out further, one can see that the market has been up by approximately 25% after two years, more than 40% after five years and more than 125% after 10 years.
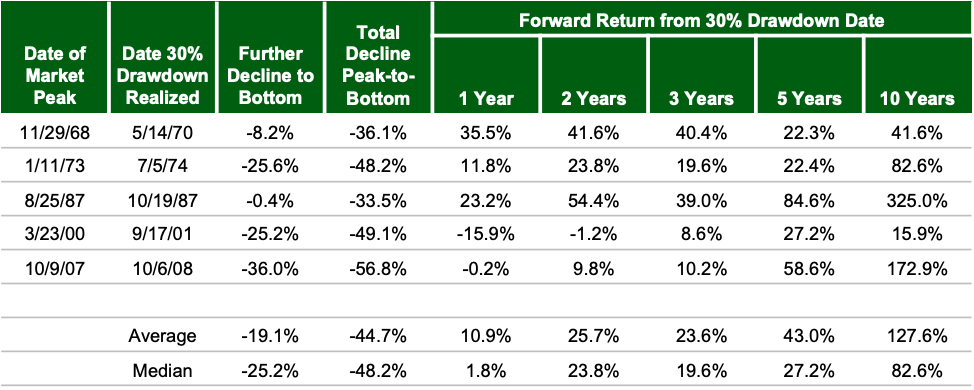
Also presented in the above table are two additional data points for each of the bear markets examined: (a) the further decline to bottom, which measures how much further the index ultimately declined from the date it crossed the 30% threshold until it found the cycle bottom and (b) the total peak-to-bottom decline of the index. This data sheds additional perspective on the results covered above by demonstrating these strong recoveries were achieved despite the market declining further in the near term, sometimes considerably so.
For instance, during the 1973-1974 bear market, the S&P 500 was nearly 12% higher one year after declining by 30% despite the fact that the index declined another 25% from that date until it achieved its ultimate cycle bottom. During the Global Financial Crisis, the S&P crossed the 30% threshold in October 2008 and kept declining an additional 36% until the total peak-to-bottom decline measured more than 55% in March 2009. Nevertheless, the market recovered swiftly and was essentially flat one year from the day it crossed the 30% threshold and was ultimately up nearly 10% two years later and considerably more so five and 10 years later.
Of course, a review of the table also reveals that things didn’t work out quite as well for investors in the near term following the bursting of the Dot Com Bubble in 2000 as the market took a longer time to ultimately find its bottom. However, a strong counterexample for investors to keep in mind is he experience of the 1987 bear market which saw the S&P 500 rebound sharply in the immediate aftermath of crossing the 30% decline threshold.
A natural desire for many investors during a bear market is to seek to identify the precise bottom for the market as the time to deploy additional capital intended for investment in stocks. In other words, many try to identify the “best” time to buy.
I reject the notion of timing the bottom as a flawed strategy for two principal reasons: (1) the bottom does not loudly announce itself when it arrives; rather, it can only be identified in retrospect and (2) missing the bottom by only a short period can prove to be quite costly in terms of missed returns as the rebound from the bottom has historically been strong and swift.
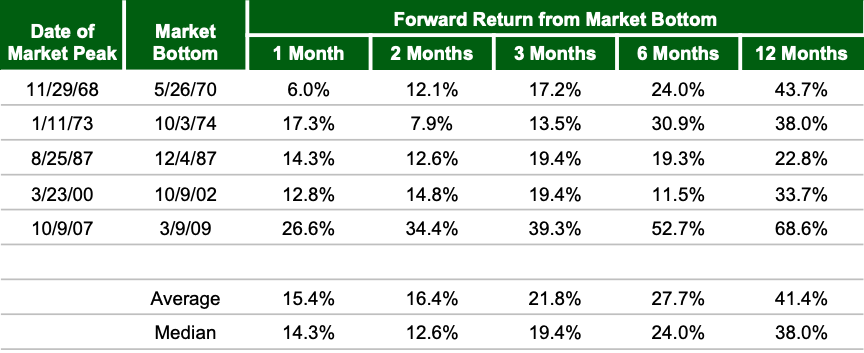
The table below examines the performance of the S&P 500 Index in the months following the past five cycle bottoms. On average, the market has gained 15% during the first month following the bottom and more than 20% during the first three months. As is usual with averages, the average conceals a bit of variability across the individual instances, but the general rule holds—rebounds from the bottom have historically been robust and rapid.
For investors contemplating deploying additional capital into stocks in light of the market’s recent declines, instead of asking yourself “is now the best time to buy?” consider reframing the question to “is now a good time to buy?” I believe the historical evidence outlined in this commentary suggests that the answer to that question is “yes.”
Sources:
S&P 500 Index daily closing values from Yahoo Finance.
Important Disclosures
Kathmere Capital Management (Kathmere) is an investment adviser registered under the Investment Advisers Act of 1940. Registration as an investment adviser does not imply any level of skill or training. The information presented in the material is general in nature and is not designed to address your investment objectives, financial situation or particular needs. Prior to making any investment decision, you should assess, or seek advice from a professional regarding whether any particular transaction is relevant or appropriate to your individual circumstances. This material is not intended to replace the advice of a qualified tax advisor, attorney, or accountant. Consultation with the appropriate professional should be done before any financial commitments regarding the issues related to the situation are made.
The opinions expressed herein are those of Kathmere and may not actually come to pass. This information is current as of the date of this material and is subject to change at any time, based on market and other conditions. Although taken from reliable sources, Kathmere cannot guarantee the accuracy of the information received from third parties.
An index is a portfolio of specific securities, the performance of which is often used as a benchmark in judging the relative performance to certain asset classes. Index performance used throughout is intended to illustrate historical market trends and performance. Indexes are managed and do not incur investment management fees. An investor is unable to invest in an index. Their performance does not reflect the expenses associated with the management of an actual portfolio. No strategy assures success or protects against loss. There is no guarantee that a diversified portfolio will enhance overall returns or outperform a non-diversified portfolio. Diversification does not protect against market risk. All investing involves risk including loss of principal. Investing in stock includes numerous specific risks including: the fluctuation of dividend, loss of principal, and potential liquidity of the investment in a falling market. Past performance is no guarantee of future results.
S&P 500: Standard & Poor’s (S&P) 500 Index. The S&P 500 Index is an unmanaged, capitalization-weighted index designed to measure the performance of the broad U.S. economy through changes in the aggregate market value of 500 stocks representing all major industries.