
11 Mar Recessions and the Stock Market
As markets have turned sharply lower recently amid growing fears regarding the potential economic fallout from the spread of the coronavirus (COVID-19), investors have asked how the stock market has fared during past recessions. In this commentary, I examine the performance of the S&P 500 Index during economic recessions as well as during their corresponding market corrections or bear markets.
The analysis covers the last 10 U.S. economic recessions, the first of which started in 1953. I rely on the National Bureau of Economic Research (NBER) for the official start and end dates of the recessions. The NBER’s Business Cycle Dating Committee is generally accepted as the official arbiter of recessions and is responsible for assigning the dates associated with turning points in the economic cycle.
What is a recession?
While the common definition of a recession is two consecutive quarters of decline in real GDP, the NBER does not following this convention. The NBER defines a recession slightly more broadly as “a significant decline in economic activity spread across the economy, lasting more than a few months, normally visible in real GDP, real income, employment, industrial production, and wholesale-retail sales.”
How has the stock market performed during recessions?
The table presented below shows, perhaps surprisingly to many, that during the last 10 recessions, which have lasted roughly 10 months on average, the S&P 500 Index has been approximately flat. The table also reveals that the S&P 500 has fallen by less than 25% on average from its peak prior to the onset of the recession. Given the stock market’s forward-looking nature, the market has peaked approximately eight months before the economy does and the recession begins, on average.
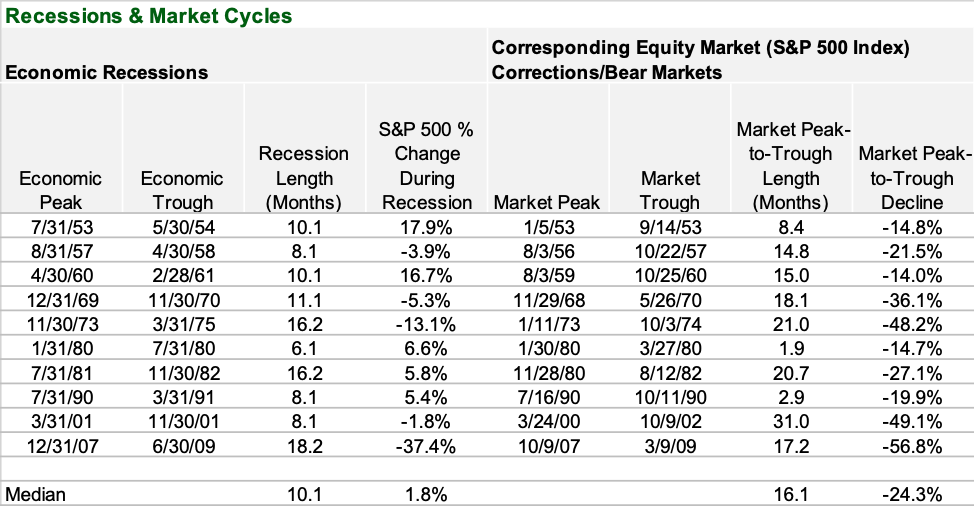
Based on a number of conversations I’ve had with investors in recent weeks and months, I suspect that many readers may be surprised to find that markets have declined by less than 25% on average around and during that last 10 recessions. I’ve found that many investors appear to be falling trap to one of the most prevalent cognitive biases highlighted by the field of behavioral economics: the availability heuristic. This mental shortcut, as defined by Wikipedia, “relies on immediate examples that come to a given person’s mind when evaluating a specific topic, concept, method or decision. The availability heuristic operates on the notion that if something can be recalled, it must be important, or at least more important than alternative solutions which are not as readily recalled. Subsequently, under the availability heuristic, people tend to heavily weigh their judgments toward more recent information, making new opinions biased toward that latest news.”
Given that the S&P 500 has declined by roughly 50% or more around the time of the last two economic recessions (those starting in 2001 and in 2008), I’ve found that many investors tend to believe that 50% or more declines are the norm when the actual historical track record presented above clearly demonstrates they are exceptions rather than the rule. In fact, fully five of the 10 recessions over the last 70 years each saw the market decline by less than 25% from its peak immediately prior the recession. Further, three of those five experienced declines of less than 20% from peak to trough.
Of course, we can’t predict with any degree of certainty where markets will go from here in the short-term. In fact, we can’t predict with much certainty whether or not the economy will ultimately fall into a recession. No doubt, the odds have likely increased in recent weeks. In any case, all investors would be well served to remember while a recessionary related market decline of 50% or more is certainly possible—and investors should be prepared for the chance that it will happen—history suggests that this should not be our base case.
Sources:
S&P 500 Index daily closing values from Yahoo Finance.
Important Disclosures
Kathmere Capital Management (Kathmere) is an investment adviser registered under the Investment Advisers Act of 1940. Registration as an investment adviser does not imply any level of skill or training. The information presented in the material is general in nature and is not designed to address your investment objectives, financial situation or particular needs. Prior to making any investment decision, you should assess, or seek advice from a professional regarding whether any particular transaction is relevant or appropriate to your individual circumstances. This material is not intended to replace the advice of a qualified tax advisor, attorney, or accountant. Consultation with the appropriate professional should be done before any financial commitments regarding the issues related to the situation are made.
The opinions expressed herein are those of Kathmere and may not actually come to pass. This information is current as of the date of this material and is subject to change at any time, based on market and other conditions. Although taken from reliable sources, Kathmere cannot guarantee the accuracy of the information received from third parties.
An index is a portfolio of specific securities, the performance of which is often used as a benchmark in judging the relative performance to certain asset classes. Index performance used throughout is intended to illustrate historical market trends and performance. Indexes are managed and do not incur investment management fees. An investor is unable to invest in an index. Their performance does not reflect the expenses associated with the management of an actual portfolio. No strategy assures success or protects against loss. There is no guarantee that a diversified portfolio will enhance overall returns or outperform a non-diversified portfolio. Diversification does not protect against market risk. All investing involves risk including loss of principal. Investing in stock includes numerous specific risks including: the fluctuation of dividend, loss of principal, and potential liquidity of the investment in a falling market. Past performance is no guarantee of future results.
S&P 500: Standard & Poor’s (S&P) 500 Index. The S&P 500 Index is an unmanaged, capitalization-weighted index designed to measure the performance of the broad U.S. economy through changes in the aggregate market value of 500 stocks representing all major industries.