
28 Feb Is Your Risk Tolerance Properly Calibrated?
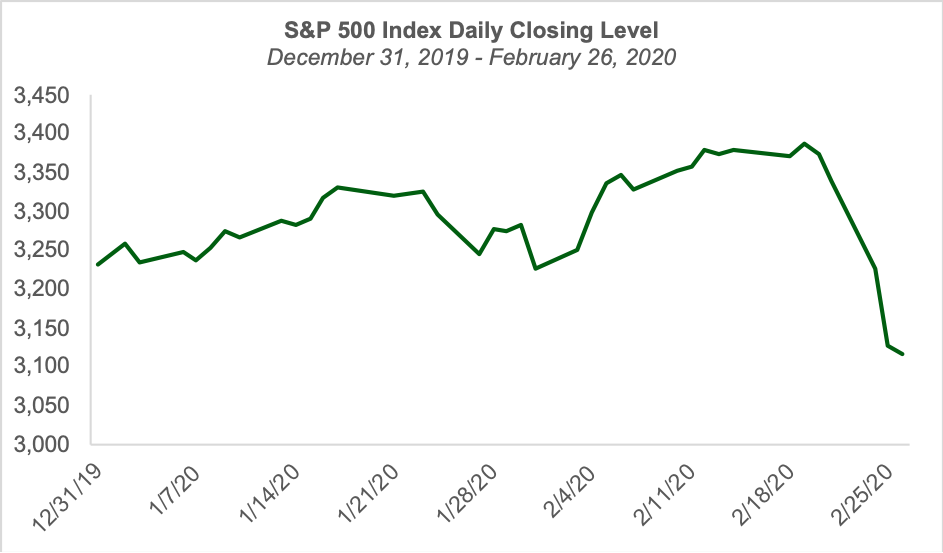
The S&P 500 Index closed at 3,116.39 on Wednesday, February 26 as fears about the global impact of the coronavirus weighed heavily on investors. As of Wednesday’s close the index was 8% off from its all-time high achieved just five trading days prior. The recent drop also pushed the index into negative territory for the year (-3.5%).
However, when we zoom out and consider the path of the S&P 500 since the beginning of the current bull market which started at its trough in during the depths of the Global Financial Crisis in March 9, 2009, the story looks quite different.
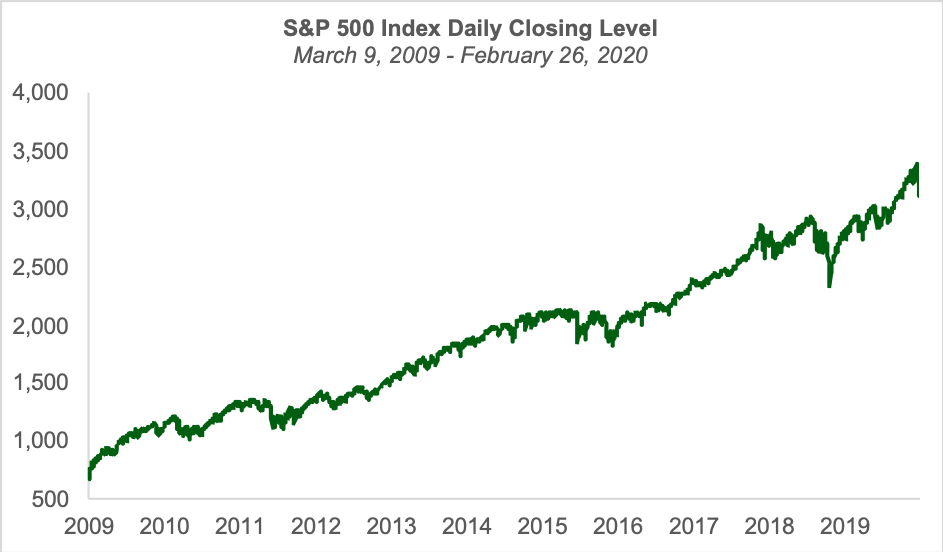
Here we can see that the recent drop, while certainly impactful and real, has left the index fully 361% higher than where it began its ascent just less than 11 years ago. What’s also apparent in the chart above is that during the current bull market, the ride has been anything but a smooth, steady march upward. As I’ve written about in previous commentaries, the market has overcome myriad obstacles and negative headlines which have provided plenty of opportunities and fodder for a skittish investor to sell and “wait until things clear up.”
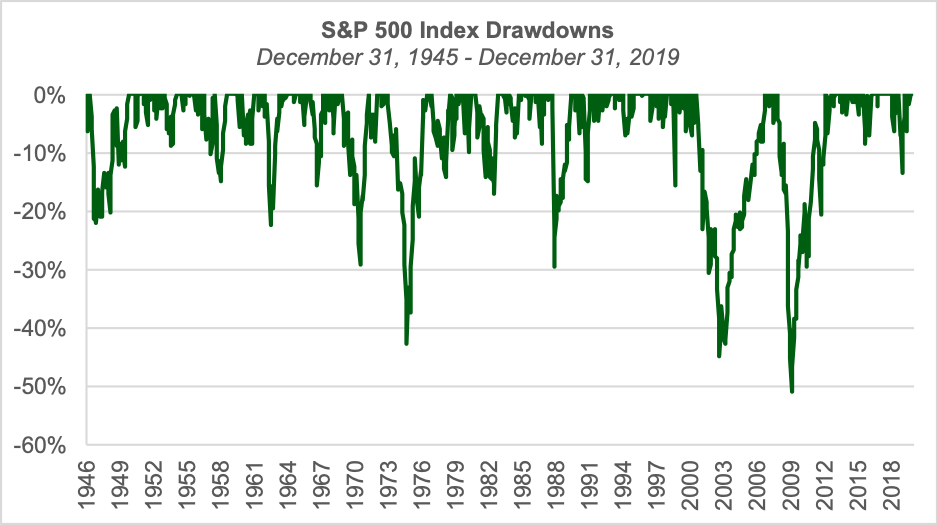
The chart below presents the S&P 500’s daily closes in a different way. In this chart, the index’s closing values are plotted in relation the index’s high-water mark since the March 9, 2009 close. When the line is along the top of the chart it signifies that the index was at a new high since he market’s trough. Meanwhile, anytime the line is not at the top of the chart, it means the index was in a drawdown from its new high. The chart clearly demonstrates that even during a bull market in which the market is up more than 300% cumulatively, the index has spent far more time in a drawdown than it has at new high levels. In fact, the during this period, the index has been in a drawdown 85% of the time. Perhaps surprisingly, the index has experienced a 5% drawdown on 18 separate occasions. Of these 18 instances, five of them saw the drawdown exceed 10% and three of them saw the drawdown exceed 15%.
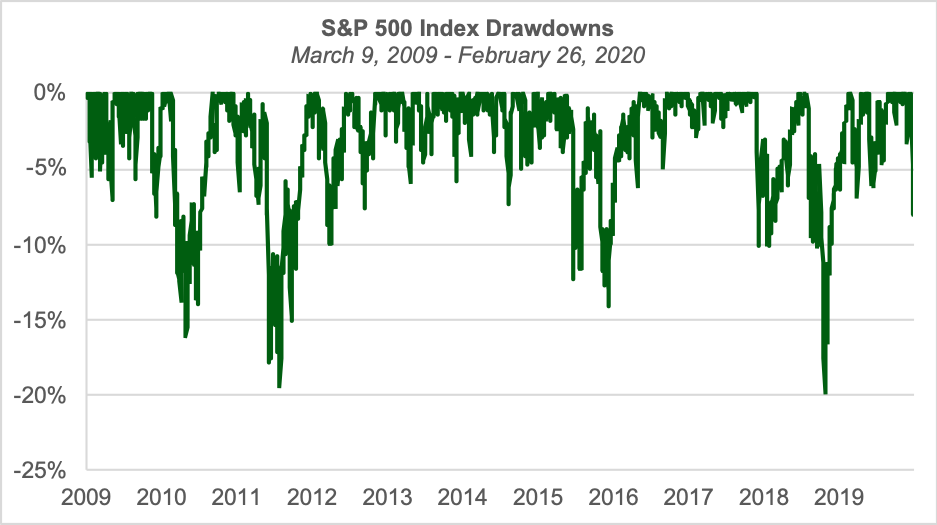
The takeaway? 5% and 10% drops, and to a lesser extent, 15% drops, are relatively frequent occurrences and are a natural part of stock market investing. I’ve often described drawdowns and volatility as part of the “price of admission” for long-term investors seeking to capture the historic rewards from investing in stocks. As we can clearly see in the chart below, investing in stocks for the long-term has historically proved rewarding.
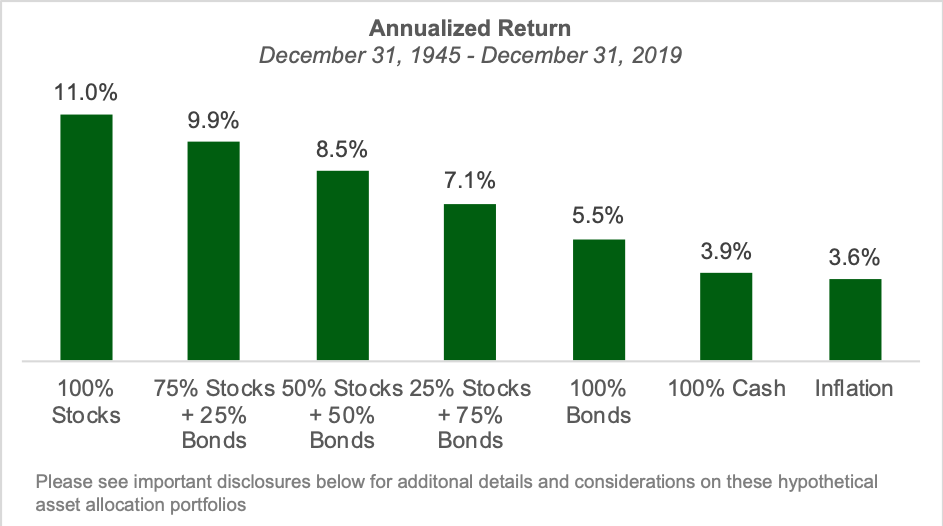
Of course, as we know, these long-term rewards have come with volatility and, at times, painful drawdowns along the way. The chart below demonstrates this point succinctly. We can see that all-stock and equity-heavy portfolios have experienced significant drawdowns over the last 74 years since the end of World War II. Simply put: risk and reward are related. Stock’s strong historic returns are in large part attributable their inherent risk. After all, for without risk, there would be no reason to expect reward.
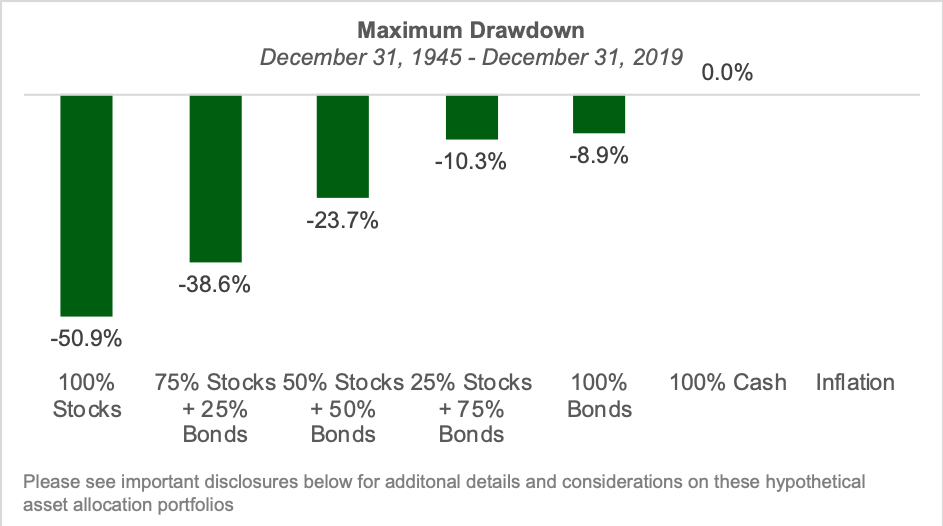
No doubt, it’s the fear that a 5% drop will turn into a 10% drop and will eventually turn into a 45% or 51% drop like those experienced in the aftermath of the Dot Com era and during the Global Financial Crisis that spooks countless investors and causes fear-driven selling during the entirely common 5% and 10% drops in the market. The chart below reveals that stock market investors need to prepare themselves for the reality that during the course of the equity investing experience, markets will experience stomach-churning declines more severe than the 5% and 10% drops that are commonplace during an otherwise upward climb.
Absent possession of the crystal ball or some other way to reliably predict when a 5% or 10% decline will ultimately turn into one of the “big ones” of 20% or more—something myriad studies of mutual fund and hedge fund performance have lent significant empirical support to the understanding that doing consistently is an extremely difficult if not impossible task—the best we, as long-term, evidence-based investors can do is to remain thoroughly diversified and ensure our risk tolerance is properly calibrated to our own unique financial situation and our psychological willingness to bear risk. Ultimately, if you find that 5% and 10% drops in the market routinely cause you angst and make you nervous, you probably are taking too much risk in your portfolio. Further, if you find the thought of your global stock holdings potentially being down 20%, 30% or even 50% to be unbearable, you probably are taking too much risk in your portfolio
If you aren’t sure or if you simply want to talk it though, please don’t hesitate to give us a call or send us an email and we’ll work through it together. It’s what we’re here for.
Sources:
S&P 500 Index daily closing values from Yahoo Finance.
Index returns from Dimensional Fund Advisors.
Important Disclosures
Kathmere Capital Management (Kathmere) is an investment adviser registered under the Investment Advisers Act of 1940. Registration as an investment adviser does not imply any level of skill or training. The information presented in the material is general in nature and is not designed to address your investment objectives, financial situation or particular needs. Prior to making any investment decision, you should assess, or seek advice from a professional regarding whether any particular transaction is relevant or appropriate to your individual circumstances. This material is not intended to replace the advice of a qualified tax advisor, attorney, or accountant. Consultation with the appropriate professional should be done before any financial commitments regarding the issues related to the situation are made.
The opinions expressed herein are those of Kathmere and may not actually come to pass. This information is current as of the date of this material and is subject to change at any time, based on market and other conditions. Although taken from reliable sources, Kathmere cannot guarantee the accuracy of the information received from third parties.
An index is a portfolio of specific securities, the performance of which is often used as a benchmark in judging the relative performance to certain asset classes. Index performance used throughout is intended to illustrate historical market trends and performance. Indexes are managed and do not incur investment management fees. An investor is unable to invest in an index. Their performance does not reflect the expenses associated with the management of an actual portfolio. No strategy assures success or protects against loss. There is no guarantee that a diversified portfolio will enhance overall returns or outperform a non-diversified portfolio. Diversification does not protect against market risk. All investing involves risk including loss of principal. Investing in stock includes numerous specific risks including: the fluctuation of dividend, loss of principal, and potential liquidity of the investment in a falling market. Past performance is no guarantee of future results.
The performance of the hypothetical asset allocation portfolios was derived from the retroactive application of a model based on monthly-rebalanced mixes of the S&P 500 index and Five-Year Treasury Notes. The graphs are intended to show how diversification and different asset mixes perform over time and is not intended to represent actual portfolio returns or any strategy currently or previously offered by Kathmere. The graphs are for illustrative and educational purposes only. The returns are shown gross of fees. To Illustrate the possible effect of management fees on total return of an account, what follows is an illustration: an account that earned 5.00% “gross” each calendar year for ten years would have earned an annualized “gross” return of 5.00%, with a ten-year cumulative return of 62.89%, assuming no contributions or withdrawals. Assuming a 1.00% management fee assessed at year-end, that same account would have earned 3.95% annualized “net” return, with a ten-year cumulative return of 47.31%.
Index representation as follows: Stocks (S&P 500 Index), Bonds (Five-Year US Treasury Notes), Cash (One-Month US Treasury Bills) and Inflation (US Consumer Price Index).
S&P 500: Standard & Poor’s (S&P) 500 Index. The S&P 500 Index is an unmanaged, capitalization-weighted index designed to measure the performance of the broad U.S. economy through changes in the aggregate market value of 500 stocks representing all major industries.
Five-Year U.S. Treasury Notes tracks the performance of a constant-maturity five-year U.S. Treasury notes.
One-Month U.S. Treasury Bills tracks the performance of a constant-maturity one-month U.S. Treasury bills.
U.S. Consumer Price Index as provided by the Bureau of Labor Statistics, measures price fluctuations in a basket of goods and services purchased by American households. The year over year change of the CPI, is a most popular way of determining the rate of inflation. It is published monthly and sometimes referred to as the cost-of-living index.