
27 Feb Points Are Not The Point
“Stocks plunge for a second day as the Dow lost more than 800 points on Tuesday” flashed the breaking news headline on CNBC. This came one day after CNN ran its own dramatic headline, “Dow plunges 1,000+ points on coronavirus fears; 2020 gains now wiped out”. Movements in the Dow Jones Industrial Average (the “Dow”) which is often used as a proxy for the broad U.S. stock market are typically communicated in units known as points, which represent the change in the index level. Investors need to be cautious when interpreting headlines that reference point movements, as a move of a certain magnitude is not necessarily comparable across different time periods for the simple reason that the overall index level today is generally higher than it was through much of the index’s own history.
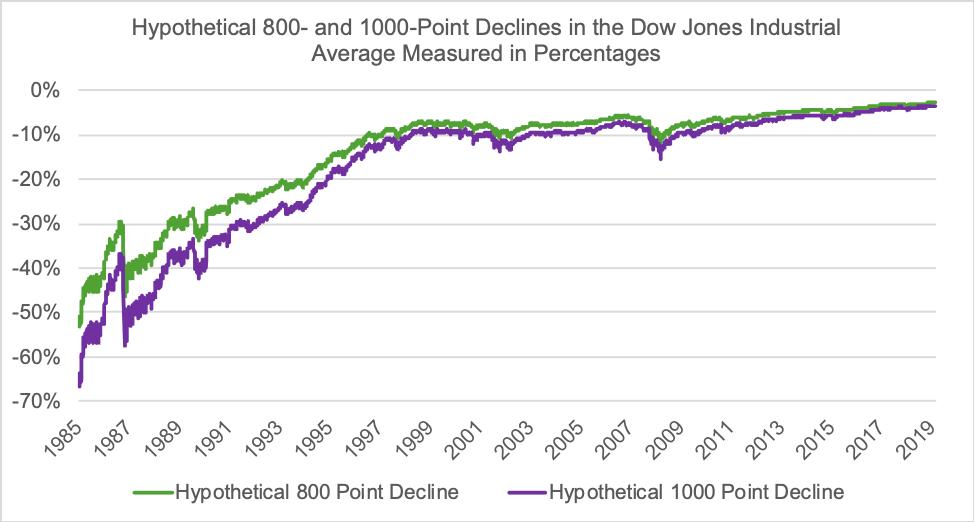
The chart above plots what a decline of 800 and 1,000 points has meant in percentage terms—what really matters to investors and their wealth—over time. The chart clearly demonstrates that point movements in the index cannot be easily compared from one period to the next. For example, we can see that a hypothetical 1,000-point loss at the end of 1985, when the index traded at just less than 1,547 would have equated to a devastating 65% decline. At the turn of the century, at the end of December 1999, when the index was at 11,497, this same hypothetical 1,000-point loss would have equated to a nearly 9% loss. Meanwhile, a 1,000-point loss based on last Friday’s index level of 28,992 equated to a loss of slightly more than 3%. Notable? Sure. Historically awful? Absolutely not, as I’ll demonstrate below.
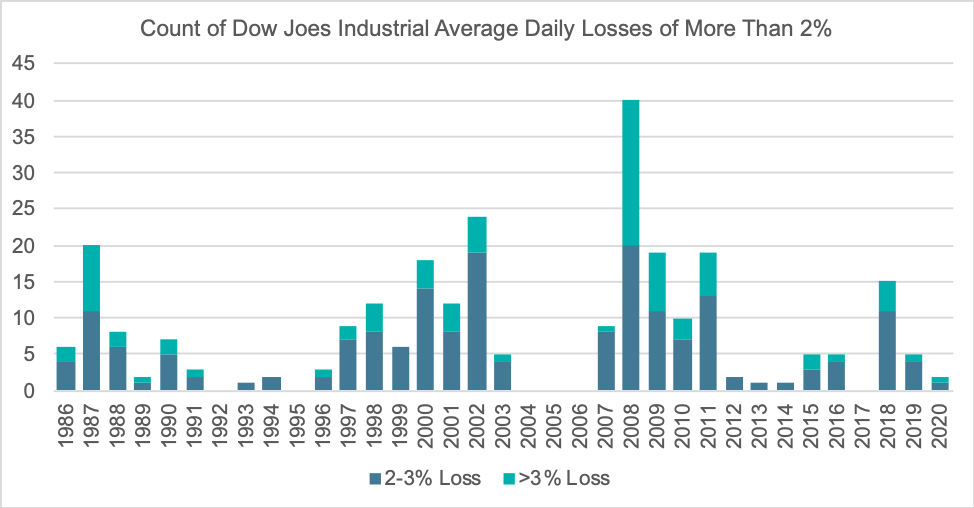
The chart below plots the frequency of daily losses of greater than 2% for the Dow dating back to the beginning on 1986. To provide an additional level of granularity, the chart further breaks these losses out into losses of 2-3% and losses greater than 3%. What we can see is that losses in excess of 2% and 3% have historically occurred somewhat frequently. In fact, from 1986-2019, on average, the Dow experienced 5.4 losses of 2-3% per year and an additional 2.5 losses in excess of 3% per year. In all, we’ve historically experienced nearly eight daily losses of more than 2% per year over the last 34 years—equivalent to two per quarter. Thus, we believe these daily losses should be viewed as an unpleasant, but entirely normal, part of equity investing.
Ultimately, investors need to be cognizant of the fact that point movements in an index need to be taken with a proverbial grain of salt. Point measures cannot be reliably compared across periods without considering the absolute index level in each of the periods being compared. Unfortunately, the financial media tends to emphasize point movements for one basic reason—they more easily lend themselves to sensational and dramatic headlines like the ones we saw at the top of this commentary. Afterall, financial news organizations are in business to draw viewership and clicks in their quest to earn advertising revenue. They are explicitly not in the business of helping investors achieve their financial and investment goals. The unfortunate reality is that sober, thoughtful analysis that seeks to put current events and market movements into proper historical context has no place in today’s fear- and greed-driven financial news cycle.
Sources:
Index data from Yahoo Finance.
Important Disclosures
Kathmere Capital Management (Kathmere) is an investment adviser registered under the Investment Advisers Act of 1940. Registration as an investment adviser does not imply any level of skill or training. The information presented in the material is general in nature and is not designed to address your investment objectives, financial situation or particular needs. Prior to making any investment decision, you should assess, or seek advice from a professional regarding whether any particular transaction is relevant or appropriate to your individual circumstances. This material is not intended to replace the advice of a qualified tax advisor, attorney, or accountant. Consultation with the appropriate professional should be done before any financial commitments regarding the issues related to the situation are made.
The opinions expressed herein are those of Kathmere and may not actually come to pass. This information is current as of the date of this material and is subject to change at any time, based on market and other conditions. Although taken from reliable sources, Kathmere cannot guarantee the accuracy of the information received from third parties.
An index is a portfolio of specific securities, the performance of which is often used as a benchmark in judging the relative performance to certain asset classes. Index performance used throughout is intended to illustrate historical market trends and performance. Indexes are managed and do not incur investment management fees. An investor is unable to invest in an index. Their performance does not reflect the expenses associated with the management of an actual portfolio. No strategy assures success or protects against loss. There is no guarantee that a diversified portfolio will enhance overall returns or outperform a non-diversified portfolio. Diversification does not protect against market risk. All investing involves risk including loss of principal. Investing in stock includes numerous specific risks including: the fluctuation of dividend, loss of principal, and potential liquidity of the investment in a falling market. Past performance is no guarantee of future results.
The Dow Jones Industrial Average, or simply the Dow, is a stock market index that measures the stock performance of 30 large companies listed on stock exchanges in the United States.