
11 Feb Long-Term Capital Markets Forecasts Roundup
Every year during the later stages of the fourth quarter and into the early part of the first quarter, a number of large asset managers and researchers publish updates to their medium- to long-term capital markets forecasts for major asset classes. In this commentary, I provide a roundup of the forecasts provided by a selection of highly regarded and well-known asset managers and researchers.
It’s important to recognize that these estimates are intended to assist investors with their planning and strategic asset allocation decisions and to help them to establish appropriate expectations for how the major asset classes are projected to perform in 10 or so years ahead. As with any attempt to forecast the future, these projections are highly uncertain and are explicitly not intended to be used for market timing.
While each forecaster employs their own specific methodology to generating their unique forecasts, there are some commonalities shared across all of the methodologies. Generally, the forecasts are based on the empirically based recognition that over intermediate horizons (e.g., 10 or so years) initial market yields and valuations tend to be the most important drivers of subsequent returns. Meantime, over very long horizons (e.g., multiple decades), the impact of initial yields and valuations is significantly diluted while over shorter horizons (e.g., less than 5 years) returns are largely unpredictable and subject to extremely large forecasting errors.
The table below presents a summary of the long-term capital markets forecasts provided by J.P. Morgan Asset Management, BlackRock, Vanguard, AQR and Research Affiliates. The table also includes the average of the forecasts as well as the annualized return of an index measuring the market segment over the last 10 years as of the end of 2019.
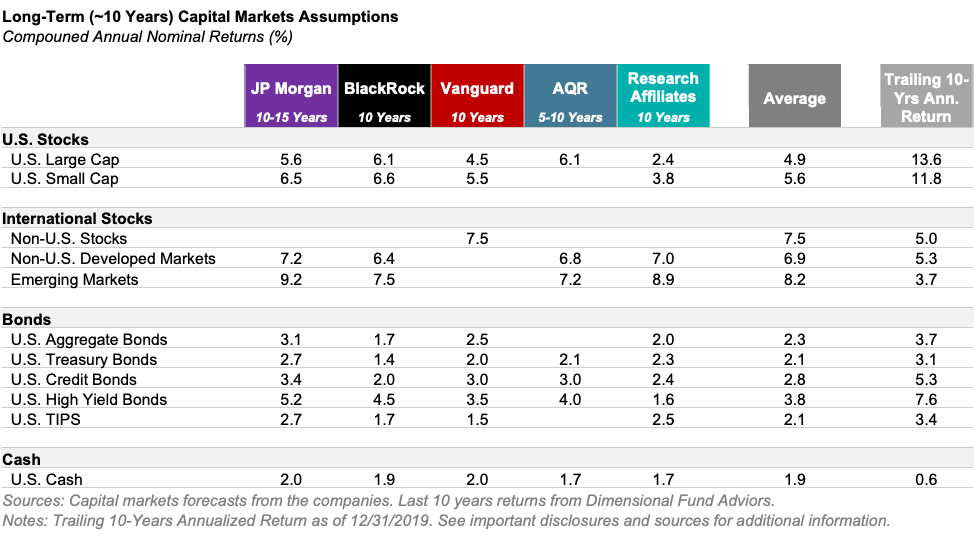
While the individual forecasts are no doubt varied, a few general observations are still warranted:
- U.S. stock returns are broadly expected to be considerably lower than those realized during the last decade.
- International and emerging markets stocks are uniformly expected to offer a higher return than large-cap U.S. stocks after markedly lagging over the last decade.
- U.S. bonds’ prospective returns are notably muted owing to the prevailing low interest rate environment.
- A positive relationship is still expected between risk and return as high-quality bonds are expected to outperform cash, lower-quality bonds are expected to outperform higher quality ones and stocks are expected to outpace bonds.
My take away from my review of all of these forecasts—including the robust analyses and frameworks that went into producing them—is that investors broadly would be well-served to pay heed to the adage that past is not prologue and to ensure that their return expectations for major asset classes in the years ahead are well grounded in a forward-looking reality as opposed to simply anchored to the recent past. As Research Affiliates succinctly put it in their outlook “past returns are poor—even perverse—predictors of future returns.” For many this may mean preparing for lower returns as a base line expectation (especially for large-cap U.S. stocks) and recognizing that the top performing assets of yesteryear may not be tomorrow’s winners. Nonetheless, I believe that time-tested principles of portfolio construction such as diversification, discipline and the importance of low costs are expected the be as important as ever in the years ahead.
I’ll conclude with three of my favorite quotes from the various managers’ forecasts:
“We again emphasize that our return estimates for all asset classes are highly uncertain. The estimates in this report do not in themselves warrant aggressive tactical allocation responses—but they may warrant other kinds of responses. For example, investment objectives may need to be reassessed, even if this necessitates higher contribution rates and lower expected payouts.” — AQR
“Capital markets may surprise to the upside or the downside, but as a base line we encourage investors to contemplate that the returns of the last decade are very unlikely to repeat and therefore to position themselves for more muted returns in the decade ahead. We wish we could be more exuberant, but that would be a disservice to all if we ignored the facts.” — Research Affiliates
“Despite our expectations of modest growth and modest returns, on average, over the next 10 to 15 years, we remain optimistic at heart.” — J.P. Morgan Asset Management
Sources for Capital Markets Forecasts
J.P. Morgan Asset Management: “2020 Long-Term Capital Market Assumptions: 24th Annual Edition”
BlackRock: BlackRock Investment Institute Capital Markets Assumptions Web Portal (as of November 2019)
Vanguard: “Vanguard Economic and Market Outlook for 2020: The New Age of Uncertainty”
AQR: “Capital Market Assumptions for Major Asset Classes: Alternative Thinking 1Q20”
Research Affiliates: “Forecasts or Nowcasts? What’s on the Horizon for the 2020s” and Research Affiliates Online Asset Allocation Interactive (as of 12/31/2019)
Other Sources
Index returns from Dimensional Fund Advisors
Notes
All capital markets forecasts represent compound annual returns.
All forecasts are presented above as nominal returns; AQR’s forecasts are presented by AQR as real returns to which AQR’s forecasted inflation figured was added to arrive at a nominal return forecast.
Index Representations
U.S. Large Cap: S&P 500 Index
U.S. Small Cap: Russell 2000 Index
Non-U.S. Stocks: MSCI All Country World ex USA Index
Non-U.S. Developed Markets Stocks: MSCI World ex USA Index
Emerging Markets Stocks: MSCI Emerging Markets Index
U.S. Aggregate Bonds: Bloomberg Barclays U.S. Aggregate Bond Index
U.S. Treasury Bonds: Bloomberg Barclays U.S. Treasury Index
U.S. Credit Bonds: Bloomberg Barclays U.S. Credit Bond Index
U.S. High Yield Bonds: Bloomberg Barclays U.S. High Yield Corporate Bond Index
U.S. TIPS: Bloomberg Barclays U.S. TIPS Index
U.S. Cash: BofA Merrill Lynch 3-Month U.S. Treasury Bill Index
Important Disclosures
Kathmere Capital Management (Kathmere) is an investment adviser registered under the Investment Advisers Act of 1940. Registration as an investment adviser does not imply any level of skill or training. The information presented in the material is general in nature and is not designed to address your investment objectives, financial situation or particular needs. Prior to making any investment decision, you should assess, or seek advice from a professional regarding whether any particular transaction is relevant or appropriate to your individual circumstances. This material is not intended to replace the advice of a qualified tax advisor, attorney, or accountant. Consultation with the appropriate professional should be done before any financial commitments regarding the issues related to the situation are made.
The opinions expressed herein are those of Kathmere and may not actually come to pass. This information is current as of the date of this material and is subject to change at any time, based on market and other conditions. Although taken from reliable sources, Kathmere cannot guarantee the accuracy of the information received from third parties.
An index is a portfolio of specific securities, the performance of which is often used as a benchmark in judging the relative performance to certain asset classes. Index performance used throughout is intended to illustrate historical market trends and performance. Indexes are managed and do not incur investment management fees. An investor is unable to invest in an index. Their performance does not reflect the expenses associated with the management of an actual portfolio. No strategy assures success or protects against loss. There is no guarantee that a diversified portfolio will enhance overall returns or outperform a non-diversified portfolio. Diversification does not protect against market risk. All investing involves risk including loss of principal. Investing in stock includes numerous specific risks including: the fluctuation of dividend, loss of principal, and potential liquidity of the investment in a falling market. Past performance is no guarantee of future results.
S&P 500 Index is a market-capitalization-weighted index of the 500 largest U.S. publicly traded companies.
Russell 2000 Index measures the performance of the 2,000 smallest companies in the Russell 3000® Index, which represents approximately 10% of the total market capitalization of the Russell 3000 Index.
MSCI All Country World ex USA Index captures large- and mid-cap representation across 22 of 23 Developed Markets (DM) countries (excluding the US) and 23 Emerging Markets (EM) countries. With 1,854 constituents, the index covers approximately 85% of the global equity opportunity set outside the US.
MSCI World ex USA Index is a free float‐adjusted market capitalization weighted index that is designed to measure the equity market performance of 22 of the 23 developed markets included the MSCI World Index (excluding the US).
MSCI Emerging Markets Index is a free-float-adjusted market-capitalization-weighted index that is designed to measure the equity market performance of emerging markets. The MSCI Emerging Markets Index consists of 23 emerging markets country indexes.
Bloomberg Barclays US Aggregate Index is a broad-based benchmark that measures the investment-grade, U.S. dollar-denominated, fixed-rate taxable bond market. The index includes Treasuries, government-related and corporate securities, MBS (agency fixed-rate and hybrid ARM pass-throughs), ABS, and CMBS (agency and non-agency).
Bloomberg Barclays US Treasury Index measures US dollar-denominated, fixed-rate, nominal debt issued by the US Treasury. Treasury bills are excluded by the maturity constraint, but are part of a separate Short Treasury Index.
Bloomberg Barclays US Credit Index measures the investment-grade, US dollar-denominated, fixed-rate, taxable corporate and government-related bond markets.
Bloomberg Barclays US Corporate High Yield Index measures the USD-denominated, high yield, fixed-rate corporate bond market. Securities are classified as high yield if the middle rating of Moody’s, Fitch and S&P is Ba1/BB+/BB+ or below.
Bloomberg Barclays US TIPS Index is a rules-based, market value-weighted index that tracks inflation-protected securities issued by the U.S. Treasury.
BofA Merrill Lynch 3-Month U.S. Treasury Bill Index is an unmanaged market index of U.S. Treasury securities maturing in 90 days that assumes reinvestment of all income.