
15 Jan How Have Markets Fared After Great Years?
Following the S&P 500 Index’s stellar 31.5% gain in 2019 (including the reinvestment of dividends), it’s natural for many investors to wonder how the market has historically fared following past “great” years to see if the past offers any clues as to what to expect in the future.
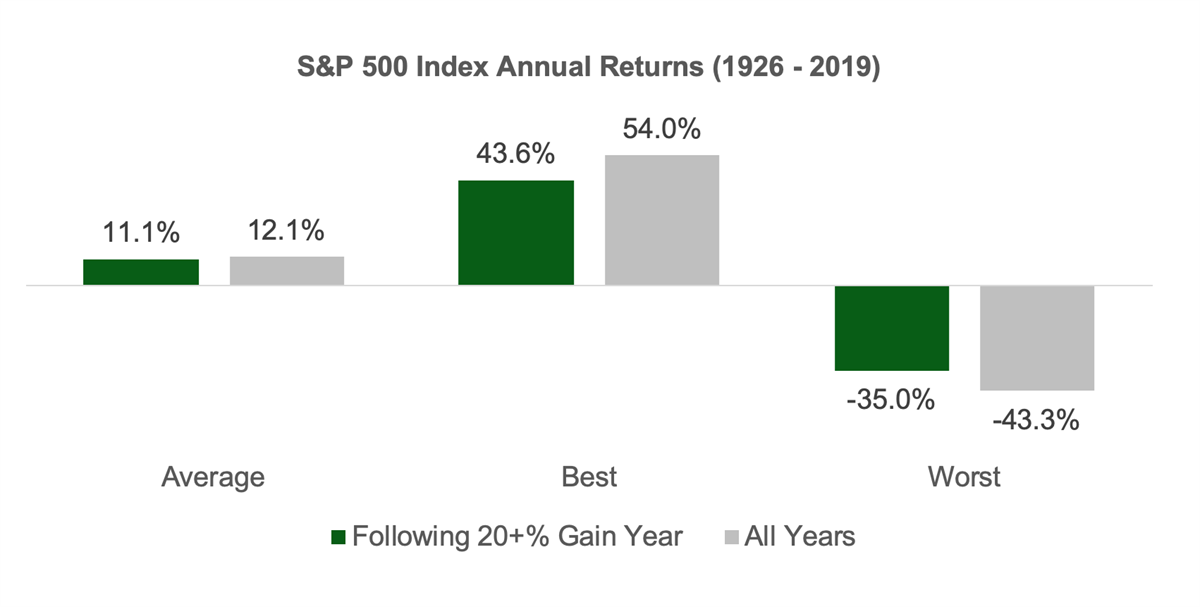
Since the beginning of 1926, the S&P 500 has delivered total returns in excess of 20% on 35 separate occasions. The chart below shows that on average, the S&P 500 has returned slightly more than 11% in years following a >20% gain. While slightly less than the 12% gain delivered on average during the full 94-year period assessed, the return is still solidly in positive territory and insignificantly different from the full-period average. This finding suggests that particularly strong individual calendar year returns contain little actionable information for long-term investors. The chart below also demonstrates that the best and worst calendar year returns for the S&P 500 are immaterially different from the full-period results.
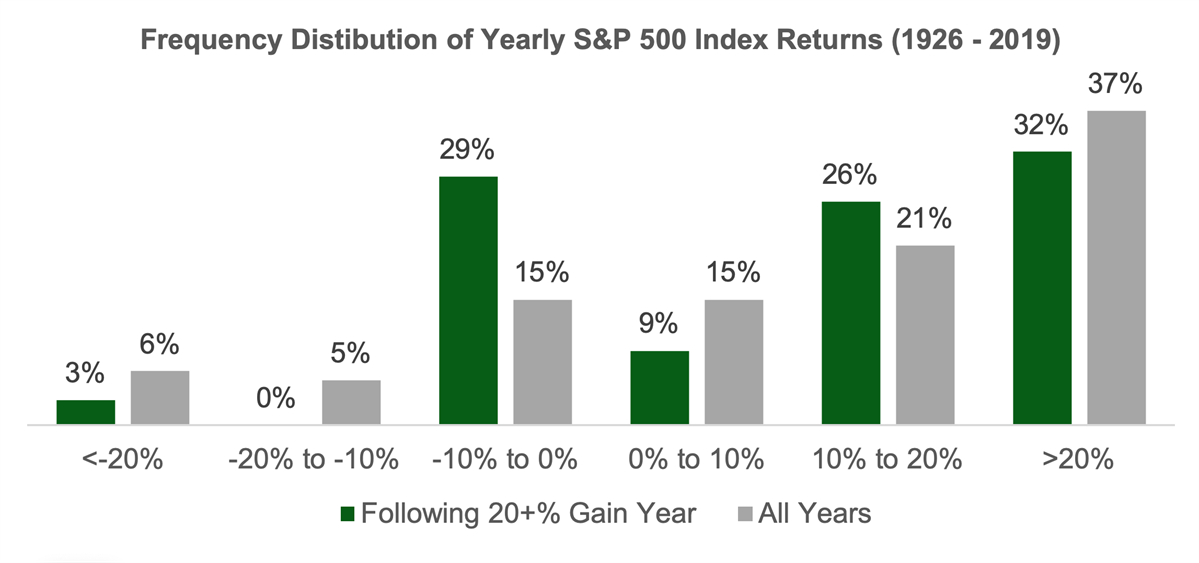
To round out the analysis, I also examined the frequency distribution of calendar year returns for the S&P 500 following >20% gain years and compared it to the full-period results. Once again, the historical evidence suggests that strong single year returns are of limited value in formulating expectations for the year ahead.
Sources:
All index return figures from Dimensional Fund Advisors
Important Disclosures
Kathmere Capital Management (Kathmere) is an investment adviser registered under the Investment Advisers Act of 1940. Registration as an investment adviser does not imply any level of skill or training. The information presented in the material is general in nature and is not designed to address your investment objectives, financial situation or particular needs. Prior to making any investment decision, you should assess, or seek advice from a professional regarding whether any particular transaction is relevant or appropriate to your individual circumstances. This material is not intended to replace the advice of a qualified tax advisor, attorney, or accountant. Consultation with the appropriate professional should be done before any financial commitments regarding the issues related to the situation are made. The opinions expressed herein are those of Kathmere and may not actually come to pass. This information is current as of the date of this material and is subject to change at any time, based on market and other conditions. Although taken from reliable sources, Kathmere cannot guarantee the accuracy of the information received from third parties. An index is a portfolio of specific securities, the performance of which is often used as a benchmark in judging the relative performance to certain asset classes. Index performance used throughout is intended to illustrate historical market trends and performance. Indexes are managed and do not incur investment management fees. An investor is unable to invest in an index. Their performance does not reflect the expenses associated with the management of an actual portfolio. No strategy assures success or protects against loss. There is no guarantee that a diversified portfolio will enhance overall returns or outperform a non-diversified portfolio. Diversification does not protect against market risk. All investing involves risk including loss of principal. Investing in stock includes numerous specific risks including: the fluctuation of dividend, loss of principal, and potential liquidity of the investment in a falling market. Past performance is no guarantee of future results. S&P 500: Standard & Poor’s (S&P) 500 Index. The S&P 500 Index is an unmanaged, capitalization-weighted index designed to measure the performance of the broad U.S. economy through changes in the aggregate market value of 500 stocks representing all major industries.