
09 May The Link Between Recession Duration and Stock Market Drawdowns
In a recent post (“What Gives?”) I offered one potential explanation as to why the S&P 500 is within shouting distance of its all-time high while the economic environment remains so clearly poor. The argument was that individual stocks—and by extension the market as a whole—derive the preponderance of their value from their long-term earnings vs. those in the very near term. By extension, this logic implies that the duration of the hit to earnings is significant and that longer, more drawn out recessions and stretches of poor earnings should cause a more significant impairment to the market’s intrinsic value than shorter recessions would.
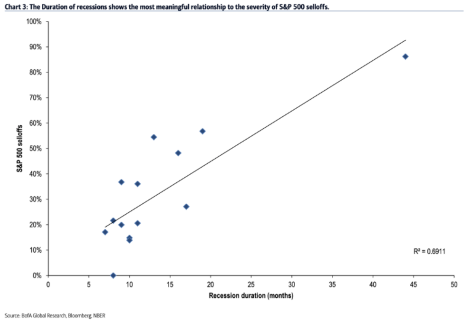
A recent chart from Bank of America Merrill Lynch lends some support to this argument at least in terms of how the market collectively has historically reacted to past recessions. The chart, presented below, reveals a relatively strong correlation between the length of past recessions and the total high-to-low drawdown for the S&P 500. The chart, which includes recessions since 1928, demonstrates that historically, the market has been most concerned not with how deep the recession is, but rather how long it goes on for.
Sources:
The Reformed Broker “The S&P 500 is Mostly Concerned with Duration (Chart)” & Bank of America Merrill Lynch
Important Disclosures
Kathmere Capital Management (Kathmere) is an investment adviser registered under the Investment Advisers Act of 1940. Registration as an investment adviser does not imply any level of skill or training. The information presented in the material is general in nature and is not designed to address your investment objectives, financial situation or particular needs. Prior to making any investment decision, you should assess, or seek advice from a professional regarding whether any particular transaction is relevant or appropriate to your individual circumstances. This material is not intended to replace the advice of a qualified tax advisor, attorney, or accountant. Consultation with the appropriate professional should be done before any financial commitments regarding the issues related to the situation are made.
The opinions expressed herein are those of Kathmere and may not actually come to pass. This information is current as of the date of this material and is subject to change at any time, based on market and other conditions. Although taken from reliable sources, Kathmere cannot guarantee the accuracy of the information received from third parties.
An index is a portfolio of specific securities, the performance of which is often used as a benchmark in judging the relative performance to certain asset classes. Index performance used throughout is intended to illustrate historical market trends and performance. Indexes are managed and do not incur investment management fees. An investor is unable to invest in an index. Their performance does not reflect the expenses associated with the management of an actual portfolio. No strategy assures success or protects against loss. There is no guarantee that a diversified portfolio will enhance overall returns or outperform a non-diversified portfolio. Diversification does not protect against market risk. All investing involves risk including loss of principal. Investing in stock includes numerous specific risks including: the fluctuation of dividend, loss of principal, and potential liquidity of the investment in a falling market. Past performance is no guarantee of future results.
S&P 500: Standard & Poor’s (S&P) 500 Index. The S&P 500 Index is an unmanaged, capitalization-weighted index designed to measure the performance of the broad U.S. economy through changes in the aggregate market value of 500 stocks representing all major industries.