
18 Mar Markets After Big Drawdowns
Following the S&P 500 Index’s sharp drop on March 12, the index stood 26.7% below its all-time high close which it achieved less than a month earlier on February 19. The index’s fall has remarkable for both its speed as well as the daily volatility that’s accompanied it. This marks the the ninth time since the start of 1928 that the S&P has declined by more than 25% from an all-time high. In this brief commentary, I examine how markets have historically fared during the eight prior instances when the S&P declined by 25% or more from an all-time high.
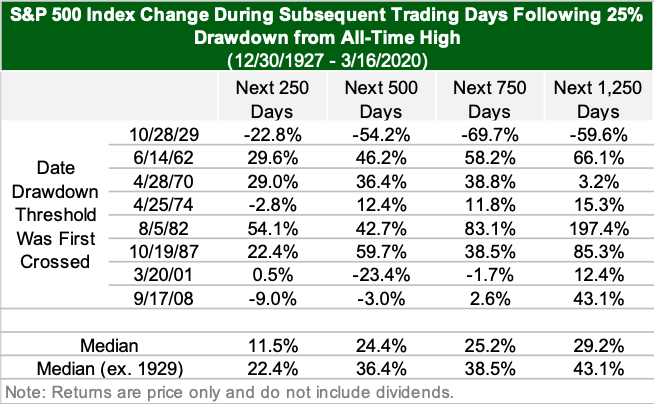
The table below presents how the S&P performed during the subsequent 250, 500, 750 and 1,250 trading days following the date at which the 25% threshold was first crossed. These dates roughly approximate 1, 2, 3 and 5 years as historically, there have been approximately 250 trading days per year during the period covered.
This data demonstrates that the market has historically tended to recover quite well in the years following a 25% drawdown. On average, the market has been up by more than 10% one year after crossing the 25% drawdown threshold. Further, the market has been up by nearly 25% two and three years from the date at which the drawdown threshold was crossed and nearly 30% five years after the fact.
A cursory examination of the table also clearly reveals that the market environment that coincided with the Great Depression, which started in 1929 and continued into the 1930s, stands out as the true exception in this analysis. Excluding the October 1929 date from the results revises that average gains in the years following the 25% drawdown measurably upwards. Excluding the experience of the Great Depression, markets have, on average, been up by more than 20% in the year following a 25% drop and have been up by more than 35%, on average, 2, 3 and 5 years after the drop.
Of course, we have no way of knowing exactly how markets will perform in the weeks and months ahead. However, history the historical experience strongly suggests that disciplined investors with the wherewithal to “stay the course” after facing sharp declines like the one we’re currently experiencing have historically been rewarded for their fortitude. We steadfastly believe this to be the case today too.
Sources:
S&P 500 Index daily closing values from Yahoo Finance.
Important Disclosures
Kathmere Capital Management (Kathmere) is an investment adviser registered under the Investment Advisers Act of 1940. Registration as an investment adviser does not imply any level of skill or training. The information presented in the material is general in nature and is not designed to address your investment objectives, financial situation or particular needs. Prior to making any investment decision, you should assess, or seek advice from a professional regarding whether any particular transaction is relevant or appropriate to your individual circumstances. This material is not intended to replace the advice of a qualified tax advisor, attorney, or accountant. Consultation with the appropriate professional should be done before any financial commitments regarding the issues related to the situation are made.
The opinions expressed herein are those of Kathmere and may not actually come to pass. This information is current as of the date of this material and is subject to change at any time, based on market and other conditions. Although taken from reliable sources, Kathmere cannot guarantee the accuracy of the information received from third parties.
An index is a portfolio of specific securities, the performance of which is often used as a benchmark in judging the relative performance to certain asset classes. Index performance used throughout is intended to illustrate historical market trends and performance. Indexes are managed and do not incur investment management fees. An investor is unable to invest in an index. Their performance does not reflect the expenses associated with the management of an actual portfolio. No strategy assures success or protects against loss. There is no guarantee that a diversified portfolio will enhance overall returns or outperform a non-diversified portfolio. Diversification does not protect against market risk. All investing involves risk including loss of principal. Investing in stock includes numerous specific risks including: the fluctuation of dividend, loss of principal, and potential liquidity of the investment in a falling market. Past performance is no guarantee of future results.
S&P 500: Standard & Poor’s (S&P) 500 Index. The S&P 500 Index is an unmanaged, capitalization-weighted index designed to measure the performance of the broad U.S. economy through changes in the aggregate market value of 500 stocks representing all major industries.