
23 Jan How Have Markets Fared After Great Decades?
In a recent commentary I took a look at how the U.S. stock market, as measured by the S&P 500 Index, has historically fared following “great” years such as 2019 when the market delivered a stellar 31.5% return. In this brief commentary, I extend the observation horizon to examine how the S&P 500 has historically fared following “great” decades such as the recently completed 2010s to see, once again, if the past offers any clues as to what we can expect in the future.
Over the last 10 years, as of the end of 2019, the S&P 500 was up 13.6% annually. Given this stronger-than-average performance, a common refrain heard today is that we’re “due” for a weaker decade ahead. Implicit in this line of reasoning is that the past is indicative of the future. To examine this logic, in the chart below, I plot the return on the S&P 500 over rolling prior 10-year periods (x-axis) in relation to the index’s returns over subsequent 10-year periods (y-axis) on a monthly basis.
Each dot on the chart represents an individual month beginning in January 1926 through December 2009 a plots the return on the index over the previous 10 years and the next 10 years. For example, the dot highlighted with the red arrow on the chart represents the December 2009, the most recent dot on the chart, which demonstrates that the index returned -0.9% annually over the previous 10 years (January 2000 to December 2009) and went on to return 13.6% annually over the next 10 years. In all, the chart plots 889 unique, overlapping monthly observations.
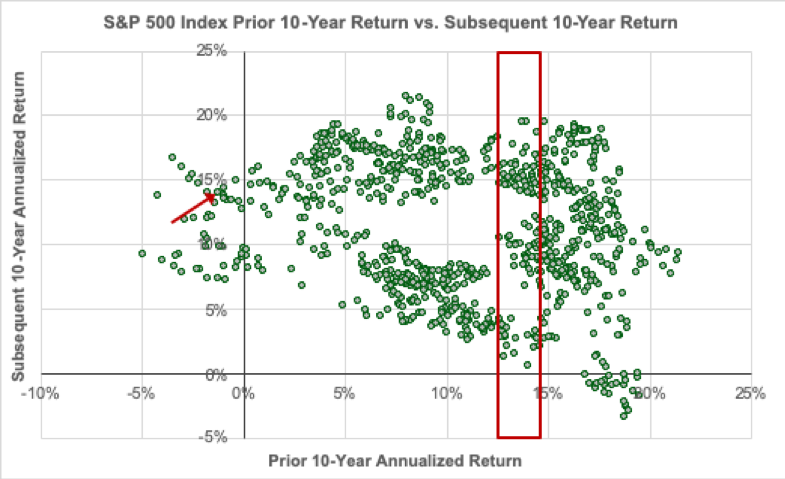
A high-level examination of the chart reveals that on the whole, there appears to be a modest negative relationship, on average, between past and future 10-year returns. In other words, all else equal, it is reasonable to expect lower returns in the coming decade as a result of the the past decade’s strong results.
However, it’s critical to keep in mind that there’s a considerable amount of variability around this average modest negative relationship which certainly undermines its usefulness as a tool for predicting future performance. For example, the red box on the chart highlights the 93 historical observations where the prior 10-year return was within +/- 1% of the last decade’s 13.6% annualized return (i.e., it covers observations for which the market had returned between 12.6% and 14.6% annually over the prior 10 years). For these observations, we can see an enormous range of subsequent 10-year returns—returns have been as low as 0.5% per year and as high as 19.4% per year. We observe a similar degree of variability across the entire range of past outcomes suggesting that past returns are of little use in predicting future returns with any reasonable degree of accuracy.
Ultimately, while I believe there are some potentially compelling arguments to be made as to why it’s reasonable to expect the performance of U.S. stocks in the coming decade to lag that of the past decade—low interest rates and low earnings yields primary among them—the fact that returns were strong over the last 10 years does not appear to be one of them.
Sources:
All index return figures from Dimensional Fund Advisors
Important Disclosures
Kathmere Capital Management (Kathmere) is an investment adviser registered under the Investment Advisers Act of 1940. Registration as an investment adviser does not imply any level of skill or training. The information presented in the material is general in nature and is not designed to address your investment objectives, financial situation or particular needs. Prior to making any investment decision, you should assess, or seek advice from a professional regarding whether any particular transaction is relevant or appropriate to your individual circumstances. This material is not intended to replace the advice of a qualified tax advisor, attorney, or accountant. Consultation with the appropriate professional should be done before any financial commitments regarding the issues related to the situation are made.
The opinions expressed herein are those of Kathmere and may not actually come to pass. This information is current as of the date of this material and is subject to change at any time, based on market and other conditions. Although taken from reliable sources, Kathmere cannot guarantee the accuracy of the information received from third parties.
An index is a portfolio of specific securities, the performance of which is often used as a benchmark in judging the relative performance to certain asset classes. Index performance used throughout is intended to illustrate historical market trends and performance. Indexes are managed and do not incur investment management fees. An investor is unable to invest in an index. Their performance does not reflect the expenses associated with the management of an actual portfolio. No strategy assures success or protects against loss. There is no guarantee that a diversified portfolio will enhance overall returns or outperform a non-diversified portfolio. Diversification does not protect against market risk. All investing involves risk including loss of principal. Investing in stock includes numerous specific risks including: the fluctuation of dividend, loss of principal, and potential liquidity of the investment in a falling market. Past performance is no guarantee of future results.
S&P 500: Standard & Poor’s (S&P) 500 Index. The S&P 500 Index is an unmanaged, capitalization-weighted index designed to measure the performance of the broad U.S. economy through changes in the aggregate market value of 500 stocks representing all major industries.