
06 May Concentrated
Victory Shares recently published a thought-provoking chart that caught my attention. The chart, presented below, plots the difference in trailing one-year returns between the largest 10 stocks in the S&P 500 by market cap vs. the remaining 490 constituents, as of the end of each quarter. Periods shaded in teal, presented above the horizontal axis, signify periods when the largest 10 stocks outperformed the rest of the market. Conversely, periods charted below the horizontal axis, shaded in purple, represent times when the largest, mega-cap stocks underperformed.
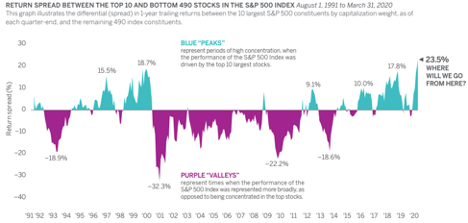
The chart strikingly reveals that as of the end of the first quarter, the 10 largest stocks had outperformed the rest of the index by more than 23% over the prior year. The recent outperformance marked a continuation of a trend that’s largely been in place for a few years now whereby the mega-caps have routinely outperformed everyone else. What’s striking about the current data point, however, is that it represents the largest margin of outperformance for the top 10 stocks dating back to the start of the analysis in 1991. Notably, the current episode bears close resemblance with the late 1990s during the height of the Tech Bubble when mega-cap stocks regularly outperformed.
Two observations:
First, in my perspective, this chart helps to explain how the broad market has remained relatively resilient in the face of the magnitude of the economic challenges facing the economy—at least temporarily—due to the coronavirus crisis (the S&P 500 was down approximately 13% from its all-time high as of the end of April). Specifically, to the extent that the top 10 stocks comprise such a significant share of the overall market (the top 10 accounted for more than 25% of the index as of the end of April) and these companies themselves are well positioned to weather the current environment, then it’s perhaps not too surprising that the overall index, which is market cap weighted, has held up decently well—or, at a minimum, better than many would typically expect in an environment where GDP is broadly expected to fall at a roughly 30% annualized pace in the second quarter and where many anticipate the unemployment rate to eclipse 20%. For those of you that are curious, the top 10 companies consist of: Microsoft, Apple, Amazon, Facebook, Berkshire Hathaway, Alphabet (Google), Johnson & Johnson, JPMorgan, Visa and Procter & Gamble. A quick glance at the chart reveals that many of these companies are likely well situated to weather the current crisis.
Second, the magnitude and duration of the recent outperformance of the largest, mega-cap stocks in the index does not appear to be sustainable from a historical perspective. Looking back at the last period when mega-caps had an extended run of outperformance in the late 1990s, we can see that it was subsequently followed by an extended period during which market leadership reversed and the mega-caps dramatically underperformed. I believe this potentially presents opportunities for indexed strategies that incorporate factors or criteria beyond just market cap in their security selection and weighting methodologies. Specifically, I believe that if and when market leadership reverses in the future, certain non-traditional indexed strategies such as those that incorporate valuation metrics or profitability and balance sheet strength criteria in selecting and allocating to specific companies may be poised to outperform traditional cap-weighted indexes.
Source:
Victory Shares: Cycles of Concentration
Important Disclosures
Kathmere Capital Management (Kathmere) is an investment adviser registered under the Investment Advisers Act of 1940. Registration as an investment adviser does not imply any level of skill or training. The information presented in the material is general in nature and is not designed to address your investment objectives, financial situation or particular needs. Prior to making any investment decision, you should assess, or seek advice from a professional regarding whether any particular transaction is relevant or appropriate to your individual circumstances. This material is not intended to replace the advice of a qualified tax advisor, attorney, or accountant. Consultation with the appropriate professional should be done before any financial commitments regarding the issues related to the situation are made.
The opinions expressed herein are those of Kathmere and may not actually come to pass. This information is current as of the date of this material and is subject to change at any time, based on market and other conditions. Although taken from reliable sources, Kathmere cannot guarantee the accuracy of the information received from third parties.
An index is a portfolio of specific securities, the performance of which is often used as a benchmark in judging the relative performance to certain asset classes. Index performance used throughout is intended to illustrate historical market trends and performance. Indexes are managed and do not incur investment management fees. An investor is unable to invest in an index. Their performance does not reflect the expenses associated with the management of an actual portfolio. No strategy assures success or protects against loss. There is no guarantee that a diversified portfolio will enhance overall returns or outperform a non-diversified portfolio. Diversification does not protect against market risk. All investing involves risk including loss of principal. Investing in stock includes numerous specific risks including: the fluctuation of dividend, loss of principal, and potential liquidity of the investment in a falling market. Past performance is no guarantee of future results.
S&P 500: Standard & Poor’s (S&P) 500 Index. The S&P 500 Index is an unmanaged, capitalization-weighted index designed to measure the performance of the broad U.S. economy through changes in the aggregate market value of 500 stocks representing all major industries.