
08 Aug What Can We Expect Following a Fed Rate Cut?
In a widely expected move, the Federal Reserve moved to cut interest rates by a quarter-percentage point on July 31. The move marked the first rate reduction since December 2008 when the Fed pushed rates to zero and ended the rate-hiking cycle that first began in December 2015. In his post announcement press conference, Fed Chairman Jerome Powell did not rule out additional rate reductions but he also stated that Fed officials did not view the cut as “the beginning of a long series of rate cuts.” Powell instead framed the move as a “mid-cycle adjustment.”
This brief commentary provides a cursory examination of how the U.S. stock market has performed in the months following the end of Fed rate-hiking cycles in an attempt to answer the lingering question of whether or not the Fed’s recent actions contain any useful information about where the markets will go from here.
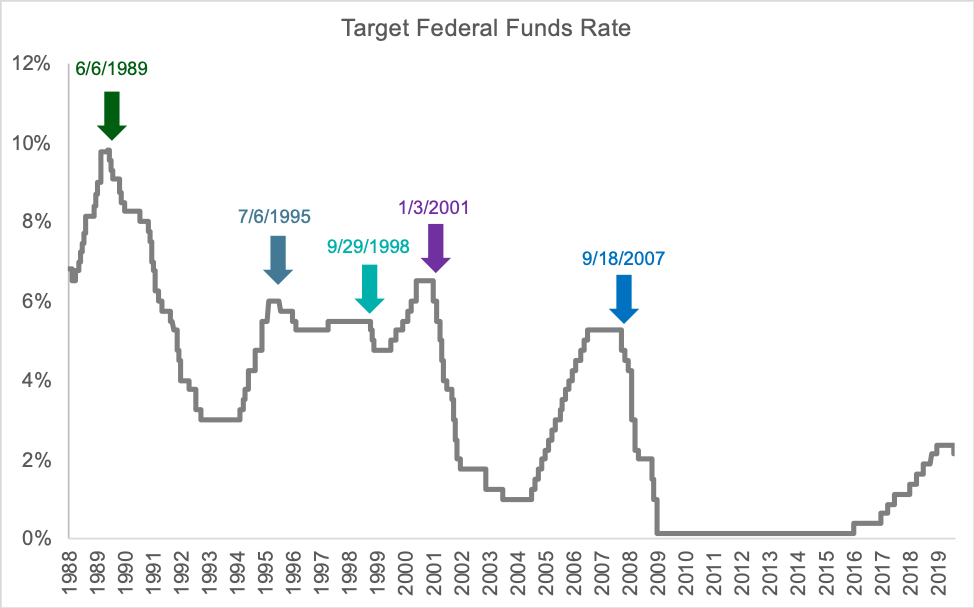
Prior the recent rate cut, since the start of 1988, there have been five separate instances of the Fed ending a rate-hiking cycle by cutting rates. The chart below depicts the history of the Target Federal Funds Rate since the beginning of 1988 and highlights the five rate cuts that marked the end of hiking cycles.
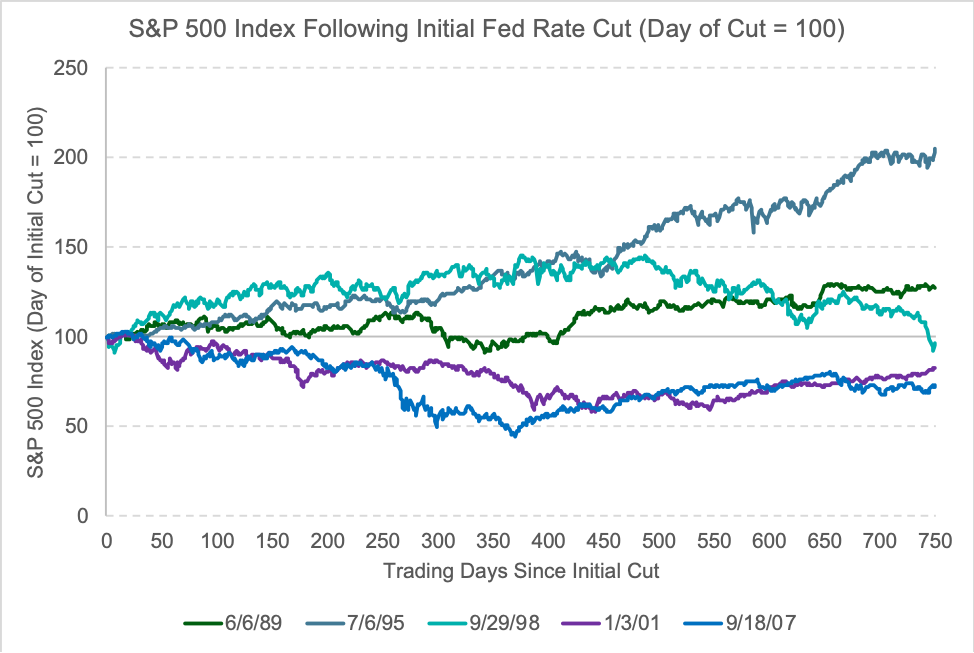
The chart below plots the movements of the S&P 500 Index over the subsequent 750 trading days (approximately three years) following the initial rate cut. In order to enable easy comparisons between each of the five cycles, the S&P 500 Index level is indexed for 100 the day of the each cut. As the chart clearly demonstrates, there has been a significant amount of variation in how the stock market has reacted to the end of rate-hiking cycles and no clear-cut pattern has emerged.
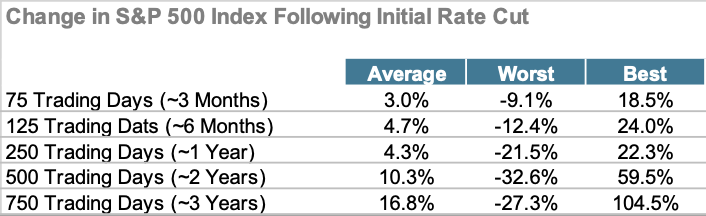
The table presented below summarizes the performance of the S&P 500 Index following the five rate cuts over various horizons ranging from approximately three months to as long as roughly three years. A quick glance at the table confirms what the chart above graphically displayed—historically there’s been a significant amount of variation in how the market has performed following an initial rate cut to end a hiking cycle. This suggests that prudent investors would be wise to not attempt to make any changes to the investment program solely on the basis of the recent rate cut.
Sources:
Federal Funds Target Rates from St. Louis Federal Reserve Bank FRED Online Database
S&P 500 Index levels from Ycharts.
IMPORTANT DISCLOSURES: Past performance is no guarantee of future results. Indices are not available for direct investment. Their performance does not reflect the expenses associated with the management of an actual portfolio. All performance referenced is historical and is no guarantee of future results. No strategy assures success or protects against loss. There is no guarantee that a diversified portfolio will enhance overall returns or outperform a non-diversified portfolio. Diversification does not protect against market risk. The opinions voiced in this material are for general information only and are not intended to provide or be construed as providing specific investment advice or recommendations for any individual security. To determine which investment(s) may be appropriate for you, consult your financial advisor prior to investing. The economic forecasts set forth in this material may not develop as predicted and there can be no guarantee that strategies promoted will be successful. All investing involves risk including loss of principal. Investing in stock includes numerous specific risks including: the fluctuation of dividend, loss of principal, and potential liquidity of the investment in a falling market.
INDEX DESCRIPTIONS: Standard & Poor’s 500 Index is a capitalization-weighted index of 500 stocks designed to measure performance of the broad domestic economy through changes in the aggregate market value of 500 stocks representing all major industries.